By default, Prometheus only learns that a Linux server is down when the node_exporter scrape on it fails. That looks exactly like a crashed exporter on a healthy box, and it tells you nothing about whether SSH answers, whether the database port accepts connections or whether the website returns a 200. Uptime monitoring needs a check from the outside, and that is the job of the Prometheus blackbox_exporter.
This guide sets up Linux server uptime monitoring with ICMP, SSH, TCP and HTTP probes, availability queries in PromQL, alert rules, Alertmanager routing with inhibition so one dead host sends one page, and a Grafana dashboard. We finish by breaking two servers on purpose and reading what fired. Every command below was run on Ubuntu 26.04, Rocky Linux 10 and Ubuntu 24.04 in November 2026.
Plan the probe layout
All the moving parts sit on one monitoring host, mon01, and the watched servers need nothing installed for the probes to work. Prometheus asks blackbox_exporter to probe a target, blackbox_exporter sends the ping or opens the connection, and the result comes back as a probe_success series of 1 or 0. Alertmanager turns failing series into notifications, and Grafana reads the same series for the dashboard.

The lab had three machines, and the table shows what each one runs and which probes point at it. Swap in your own addresses; the 10.132.0.x range is only the lab network.
| Host | OS | IP | Runs | Probes |
|---|---|---|---|---|
| mon01 | Ubuntu 26.04 | 10.132.0.16 | Prometheus, blackbox_exporter, Alertmanager, Grafana | none (it is the prober) |
| web01 | Rocky Linux 10 | 10.132.0.18 | nginx, sshd, node_exporter | ICMP, SSH banner, HTTP 2xx |
| db01 | Ubuntu 24.04 | 10.132.0.17 | MariaDB, sshd, node_exporter | ICMP, SSH banner, TCP 3306 |
Put the prober on a machine that does not share a failure with the hosts it watches. A blackbox_exporter running on the same hypervisor or in the same rack goes dark with them, and then you get silence instead of an alert.
Prepare the monitoring host
Prometheus has to be running on mon01 before any of this is useful. Install it with the guide for Prometheus on Ubuntu 26.04, or use the Ubuntu 24.04 and Debian 13 steps or the Rocky Linux and AlmaLinux steps if your monitoring host runs one of those. The configs below expect the usual layout: /etc/prometheus/prometheus.yml, a prometheus system user and a prometheus.service unit. If that unit has no ExecReload=/bin/kill -HUP $MAINPID line, add it under [Service] and run sudo systemctl daemon-reload, because the reload step later depends on it.
Host metrics are a separate job. CPU, memory, disk and load come from node_exporter on each server, and our node_exporter setup guide covers that install, and the Grafana install guide for Ubuntu covers Grafana. This guide reads only two node_exporter series:
up{job="node"}for the NodeExporterDown alertnode_boot_time_secondsfor the HostRebooted alert
You can skip node_exporter entirely and still get every probe below, because blackbox_exporter needs nothing on the watched hosts. Drop the node job and those two rules if you do, or Prometheus will alert on a target you never installed.
Install blackbox_exporter
The exporter is a single static Go binary, so it installs the same way on Ubuntu, Debian, Rocky and AlmaLinux. Create a system user for it first, because the service should never run as root:
sudo useradd --system --no-create-home --shell /usr/sbin/nologin blackboxPull the latest release tag from the GitHub API so the commands stay valid when a new version ships. You get the tag with its leading v, and the download step strips it where the file name needs the bare number.
BB_VER=$(curl -s https://api.github.com/repos/prometheus/blackbox_exporter/releases/latest | grep tag_name | cut -d '"' -f4)
echo $BB_VER
Download the tarball together with the release checksum file, and verify it before you unpack anything. This binary will hold a raw socket capability, so it’s worth the extra line.
cd /tmp
curl -sLO https://github.com/prometheus/blackbox_exporter/releases/download/${BB_VER}/blackbox_exporter-${BB_VER#v}.linux-amd64.tar.gz
curl -sLO https://github.com/prometheus/blackbox_exporter/releases/download/${BB_VER}/sha256sums.txt
sha256sum -c --ignore-missing sha256sums.txt
The only line that matters in the checksum output is OK next to the tarball name. Anything else means a truncated or tampered download, so delete it and fetch it again.
blackbox_exporter-0.29.1.linux-amd64.tar.gz: OKUnpack it, put the binary on the path and confirm the version. You install only the binary, so the sample config in the tarball stays in /tmp and won’t overwrite yours on the next upgrade.
tar xzf blackbox_exporter-${BB_VER#v}.linux-amd64.tar.gz
sudo install -m 0755 blackbox_exporter-${BB_VER#v}.linux-amd64/blackbox_exporter /usr/local/bin/
blackbox_exporter --version
Our run on mon01 reported this build. Note the version you got, because the module options below are checked against it and an older package from a distro repository may not know all of them. If your output shows a much older release, you’re running a different binary earlier in your PATH.
blackbox_exporter, version 0.29.1 (branch: HEAD, revision: ad91668339ca265f460c23fc422a27ba6d788db9)
  build user:       root@ab03ed60a291
  build date:       20261021-18:03:25
  go version:       go1.27.3
  platform:         linux/amd64
  tags:             unknown
On Rocky Linux with SELinux enforcing, the binary in /usr/local/bin gets the bin_t label and runs from systemd without any policy change. We checked the audit log after starting it there and found no denials.
Define the probe modules
A module is a named recipe for one kind of check, and every Prometheus job later picks one by name. We need four: an HTTP check that wants a 2xx, a plain TCP connect, a TCP connect that also reads the SSH banner, and an ICMP ping. Create the config directory and open the file:
sudo mkdir -p /etc/blackbox_exporter
sudo vim /etc/blackbox_exporter/blackbox.yml
Paste the four modules. Keep the names, because the Prometheus jobs later call them by exactly these strings.
modules:
  http_2xx:
    prober: http
    timeout: 5s
    http:
      preferred_ip_protocol: ip4
  tcp_connect:
    prober: tcp
    timeout: 5s
    tcp:
      preferred_ip_protocol: ip4
  ssh_banner:
    prober: tcp
    timeout: 5s
    tcp:
      preferred_ip_protocol: ip4
      query_response:
        - expect: "^SSH-2.0-"
  icmp_ipv4:
    prober: icmp
    timeout: 5s
    icmp:
      preferred_ip_protocol: ip4
Every module sets preferred_ip_protocol: ip4 because the exporter defaults to ip6. When a target hostname has both AAAA and A records, the default picks the IPv6 address, and the probe fails on a prober that only has IPv4 routing. The ssh_banner module is worth the extra lines: a bare TCP connect to port 22 still succeeds when sshd is frozen or throttled, because the kernel completes the handshake from its backlog, but a missing SSH-2.0- banner fails the probe.
Make the file readable by the service user, then validate it. Our first attempt failed here because the file had been copied in with mode 600, and the exporter refused it with open /etc/blackbox_exporter/blackbox.yml: permission denied:
sudo chmod 0644 /etc/blackbox_exporter/blackbox.yml
blackbox_exporter --config.check --config.file=/etc/blackbox_exporter/blackbox.yml
A good file ends with the exporter exiting on purpose. You want the Config file is ok exiting... line, so anything at ERROR level means the service will fail too. Fix it here, because systemd only shows you the restart loop.
time=2026-11-11T19:44:39.745Z level=INFO source=config.go:144 msg="Configuration file change detected, reloading the configuration."
time=2026-11-11T19:44:39.745Z level=INFO source=main.go:108 msg="Config file is ok exiting..."
The check does not catch a module that is valid YAML but wrong for your network, so the hand tests further down still matter.
Run blackbox_exporter under systemd
ICMP is where this setup quietly breaks. A ping needs either a raw socket, which takes the CAP_NET_RAW capability, or an unprivileged ICMP socket, which the kernel only hands to groups listed in net.ipv4.ping_group_range. Ubuntu and Rocky ship that sysctl very differently:
| Host OS | net.ipv4.ping_group_range | ICMP probe without CAP_NET_RAW |
|---|---|---|
| Ubuntu 26.04 | 1 0 (no group allowed) | probe_success 0, operation not permitted |
| Ubuntu 24.04 | 1 0 (no group allowed) | probe_success 0, operation not permitted |
| Rocky Linux 10 | 0 2147483647 (every group) | probe_success 1 |
So the same unit file works on Rocky and fails on Ubuntu. Grant the capability in the unit and it works on both, which is what we ship. Create the service file:
sudo vim /etc/systemd/system/blackbox_exporter.serviceAdd the unit with the capability lines.
[Unit]
Description=Prometheus Blackbox Exporter
Wants=network-online.target
After=network-online.target

[Service]
User=blackbox
Group=blackbox
AmbientCapabilities=CAP_NET_RAW
CapabilityBoundingSet=CAP_NET_RAW
NoNewPrivileges=true
ExecStart=/usr/local/bin/blackbox_exporter \
  --config.file=/etc/blackbox_exporter/blackbox.yml \
  --web.listen-address=:9115
ExecReload=/bin/kill -HUP $MAINPID
Restart=on-failure

[Install]
WantedBy=multi-user.target
AmbientCapabilities hands the non-root process exactly one privilege, and CapabilityBoundingSet stops it from ever gaining another. The upstream README also offers setcap cap_net_raw+ep on the binary, but that is lost every time you replace the binary during an upgrade, while the unit file survives. Load and start it:
sudo systemctl daemon-reload
sudo systemctl enable --now blackbox_exporter
systemctl status blackbox_exporter --no-pager
Look for active (running). If you see failed with a restart counter instead, run the --config.check command again, because a bad config makes systemd give up after five quick restarts.
● blackbox_exporter.service - Prometheus Blackbox Exporter
     Loaded: loaded (/etc/systemd/system/blackbox_exporter.service; enabled; preset: enabled)
     Active: active (running) since Wed 2026-11-11 19:45:38 UTC; 2s ago
   Main PID: 3111 (blackbox_export)
      Tasks: 8 (limit: 3915)
     Memory: 3.4M (peak: 3.4M)
Mind the memory figure: a few megabytes, so there’s no reason to skip a second prober in another location later. The exporter listens on every interface without authentication, and anyone who can reach port 9115 can make mon01 probe any address. Prometheus scrapes it over localhost, so keep 9115 (and Alertmanager’s 9093) closed in mon01’s firewall. If you opened 9093 while following the Ubuntu 26.04 guide, remove it with sudo ufw delete allow 9093/tcp.
Test each probe by hand
Before Prometheus gets involved, call the /probe endpoint yourself. It takes the target and module as URL parameters and returns the metrics Prometheus would scrape, so a failure here is a failure you can debug in seconds instead of minutes. Ping db01:
curl -s "http://localhost:9115/probe?target=10.132.0.17&module=icmp_ipv4" | grep -E "^probe_(success|icmp_duration)"A working ping shows probe_success 1 and a real round trip in the rtt phase. An rtt of exactly 0 with a failed probe means the packet never left mon01.
probe_icmp_duration_seconds{phase="resolve"} 5.755e-06
probe_icmp_duration_seconds{phase="rtt"} 0.002180895
probe_icmp_duration_seconds{phase="setup"} 0.000337109
probe_success 1
Run the same call with module=tcp_connect and target=10.132.0.17:3306 for the database port, module=ssh_banner with port 22 on each host, and module=http_2xx with target=http://10.132.0.18/ for the web server. When one returns 0, add &debug=true to the URL. The debug output prints the probe log, the metrics it would have returned and the module as the exporter understood it:
curl -s "http://localhost:9115/probe?target=10.132.0.17:3306&module=tcp_connect&debug=true"Our first run against db01 failed exactly this way, and the log line said why.
Logs for the probe:
time=2026-11-11T19:44:51.932Z level=ERROR source=tcp.go:92 msg="Error dialing TCP" module=tcp_connect target=10.132.0.17:3306 err="dial tcp4 10.132.0.17:3306: connect: connection refused"
time=2026-11-11T19:44:51.932Z level=ERROR source=handler.go:140 msg="Probe failed" module=tcp_connect target=10.132.0.17:3306 duration_seconds=0.000573128
A refused connection in under a millisecond means the host is up and nothing listens on that address. The fix for that, and for the ICMP permission error, is in the error section below. Don’t move on to Prometheus until every target you plan to watch returns 1 by hand.
Open the firewalls on the watched hosts
The probes only need the service ports the hosts already serve, plus 9100 if you scrape node_exporter. On web01, firewalld’s default zone already allows SSH and ICMP echo, so open HTTP and the node_exporter port:
sudo firewall-cmd --permanent --add-service=http
sudo firewall-cmd --permanent --add-port=9100/tcp
sudo firewall-cmd --reload
Use separate calls as shown. Passing --add-service and --add-port in a single firewall-cmd call was rejected on our Rocky host.
db01 is the more interesting case, because MariaDB should never be open to the whole network. Allow SSH for everyone, but limit 3306 and 9100 to the monitoring host only. Allow OpenSSH before you enable ufw, or you lock yourself out of a remote server:
sudo ufw allow OpenSSH
sudo ufw allow from 10.132.0.16 to any port 3306 proto tcp
sudo ufw allow from 10.132.0.16 to any port 9100 proto tcp
sudo ufw --force enable
sudo ufw status numbered
The rule list should name mon01’s address as the only source for the two private ports. If you see Anywhere on 3306, delete that rule by number before you go further.
Status: active

     To                         Action      From
     --                         ------      ----
[ 1] OpenSSH                    ALLOW IN    Anywhere
[ 2] 3306/tcp                   ALLOW IN    10.132.0.16
[ 3] 9100/tcp                   ALLOW IN    10.132.0.16
[ 4] OpenSSH (v6)               ALLOW IN    Anywhere (v6)
There is no ICMP rule because ufw accepts echo requests by default in its before.rules. We probed db01 again after enabling ufw and ICMP, SSH and TCP 3306 all stayed at 1. If your hardening baseline drops ICMP, the ping probe will report the host down while it is serving fine, so either allow echo from mon01 or rely on the SSH probe for liveness.
Add the probe jobs to Prometheus
Each probe type gets its own job. That costs a few lines of YAML, but it gives every series a job label you can alert on without regex, which the rules below depend on. Open the Prometheus config:
sudo vim /etc/prometheus/prometheus.ymlThis is the full file from the lab. The host label on every target is what lets Alertmanager tie a ping failure on db01 to the SSH failure on db01 later:
global:
  scrape_interval: 15s
  evaluation_interval: 15s

alerting:
  alertmanagers:
    - static_configs:
        - targets: ["localhost:9093"]

rule_files:
  - /etc/prometheus/rules/*.yml

scrape_configs:
  - job_name: "prometheus"
    static_configs:
      - targets: ["localhost:9090"]

  - job_name: "node"
    static_configs:
      - targets: ["10.132.0.18:9100"]
        labels:
          host: web01
      - targets: ["10.132.0.17:9100"]
        labels:
          host: db01

  - job_name: "blackbox"
    static_configs:
      - targets: ["localhost:9115"]

  - job_name: "blackbox_icmp"
    metrics_path: /probe
    params:
      module: [icmp_ipv4]
    static_configs:
      - targets: ["10.132.0.18"]
        labels:
          host: web01
      - targets: ["10.132.0.17"]
        labels:
          host: db01
    relabel_configs:
      - source_labels: [__address__]
        target_label: __param_target
      - source_labels: [__param_target]
        target_label: instance
      - target_label: __address__
        replacement: localhost:9115

  - job_name: "blackbox_ssh"
    metrics_path: /probe
    params:
      module: [ssh_banner]
    static_configs:
      - targets: ["10.132.0.18:22"]
        labels:
          host: web01
      - targets: ["10.132.0.17:22"]
        labels:
          host: db01
    relabel_configs:
      - source_labels: [__address__]
        target_label: __param_target
      - source_labels: [__param_target]
        target_label: instance
      - target_label: __address__
        replacement: localhost:9115

  - job_name: "blackbox_tcp"
    metrics_path: /probe
    params:
      module: [tcp_connect]
    static_configs:
      - targets: ["10.132.0.17:3306"]
        labels:
          host: db01
    relabel_configs:
      - source_labels: [__address__]
        target_label: __param_target
      - source_labels: [__param_target]
        target_label: instance
      - target_label: __address__
        replacement: localhost:9115

  - job_name: "blackbox_http"
    metrics_path: /probe
    params:
      module: [http_2xx]
    static_configs:
      - targets: ["http://10.132.0.18/"]
        labels:
          host: web01
    relabel_configs:
      - source_labels: [__address__]
        target_label: __param_target
      - source_labels: [__param_target]
        target_label: instance
      - target_label: __address__
        replacement: localhost:9115
The three relabel steps are the same in every probe job, and they are the part people get wrong. The first copies the listed target into the target URL parameter, the second keeps it as the instance label so graphs show the server rather than the exporter, and the third points the actual scrape at blackbox_exporter on localhost. The plain blackbox job scrapes the exporter’s own metrics, so you find out when the prober itself dies.
The rule_files line points at a directory that holds nothing yet. Create it now so the config check passes, and the rules file goes in the next step:
sudo mkdir -p /etc/prometheus/rulesOnce the rules file below is in place, validate everything and reload. systemctl reload runs the unit’s ExecReload line, which sends Prometheus a SIGHUP, so it rereads the config without restarting. If systemd answers that reload is not applicable for the unit, the ExecReload line from the prerequisites is missing; add it, or use sudo systemctl restart prometheus instead.
promtool check config /etc/prometheus/prometheus.yml
sudo systemctl reload prometheus
promtool checks the rule files the config points to in the same pass, so a typo in an alert expression shows up here instead of as a silent rule that never fires.
Checking /etc/prometheus/prometheus.yml
  SUCCESS: 1 rule files found
 SUCCESS: /etc/prometheus/prometheus.yml is valid prometheus config file syntax

Checking /etc/prometheus/rules/uptime.yml
  SUCCESS: 8 rules found
Open http://10.132.0.16:9090/targets after the reload. Every probe job should list its targets with state UP.

UP on a probe job only means Prometheus reached blackbox_exporter. It says nothing about the target, which is why up is the wrong metric for uptime and probe_success is the right one.
Write the uptime alert rules
One rule per probe type keeps the alert names meaningful in a notification. Create the rules file:
sudo vim /etc/prometheus/rules/uptime.ymlThese are the eight rules the drill below was run against. Adjust the severities to match how your team pages, but keep the alert names, because the inhibit rule matches on them.
groups:
  - name: uptime
    rules:
      - alert: HostUnreachable
        expr: probe_success{job="blackbox_icmp"} == 0
        for: 2m
        labels:
          severity: critical
        annotations:
          summary: "{{ $labels.host }} does not answer ping"
          description: "ICMP probe to {{ $labels.instance }} has failed for 2 minutes."

      - alert: SSHDown
        expr: probe_success{job="blackbox_ssh"} == 0
        for: 2m
        labels:
          severity: critical
        annotations:
          summary: "SSH is down on {{ $labels.host }}"
          description: "No SSH-2.0 banner from {{ $labels.instance }} for 2 minutes."

      - alert: ServicePortDown
        expr: probe_success{job="blackbox_tcp"} == 0
        for: 2m
        labels:
          severity: critical
        annotations:
          summary: "TCP port closed on {{ $labels.host }}"
          description: "TCP connect to {{ $labels.instance }} has failed for 2 minutes."

      - alert: WebsiteDown
        expr: probe_success{job="blackbox_http"} == 0
        for: 2m
        labels:
          severity: critical
        annotations:
          summary: "HTTP check failing for {{ $labels.instance }}"
          description: "{{ $labels.instance }} has not returned a 2xx for 2 minutes."

      - alert: SlowHTTPResponse
        expr: avg_over_time(probe_duration_seconds{job="blackbox_http"}[5m]) > 1
        for: 5m
        labels:
          severity: warning
        annotations:
          summary: "Slow responses from {{ $labels.instance }}"
          description: "Average probe time is {{ $value | humanizeDuration }} over 5 minutes."

      - alert: NodeExporterDown
        expr: up{job="node"} == 0
        for: 2m
        labels:
          severity: warning
        annotations:
          summary: "node_exporter not scraped on {{ $labels.host }}"
          description: "Prometheus could not scrape {{ $labels.instance }} for 2 minutes."

      - alert: HostRebooted
        expr: time() - node_boot_time_seconds < 600
        labels:
          severity: warning
        annotations:
          summary: "{{ $labels.host }} rebooted"
          description: "{{ $labels.host }} booted {{ $value | humanizeDuration }} ago."

      - alert: BlackboxExporterDown
        expr: up{job="blackbox"} == 0
        for: 1m
        labels:
          severity: critical
        annotations:
          summary: "blackbox_exporter is down"
          description: "Every probe result is stale until blackbox_exporter is back."
The for: 2m clause is what stops a single dropped packet from paging you at 3 a.m., because with a 15 second scrape, the probe has to fail about eight times in a row. Keep HostUnreachable’s for no longer than the others. The inhibition rule in the next section relies on it firing before or alongside the alerts it mutes, and the drill shows how tight that race is. Check the file on its own with promtool check rules /etc/prometheus/rules/uptime.yml, then run the config check and reload from the previous section.
Route alerts with Alertmanager
Prometheus decides what is broken, and Alertmanager decides who hears about it and how often. When db01 dies you want one page that says the host is gone, not four pages for ping, SSH, MariaDB and node_exporter. Inhibition does that. If you only need plain email for now, our older Alertmanager email notification guide is the shorter route.
The Ubuntu 26.04 Prometheus guide linked above already installs and starts Alertmanager. If yours is running, skip the install block, replace your unit with the one below if it lacks those flags, and finish this section with sudo systemctl daemon-reload and sudo systemctl restart alertmanager. Without the restart the running process keeps its old config, so amtool config routes test passes while the live Alertmanager has no inhibit rule.
On a fresh host, install it the same way as the exporter, with its own user, a config directory and a data directory. The data directory keeps silences and notification state across restarts, so it must belong to the service user.
sudo useradd --system --no-create-home --shell /usr/sbin/nologin alertmanager
sudo mkdir -p /etc/alertmanager /var/lib/alertmanager
sudo chown alertmanager:alertmanager /var/lib/alertmanager
AM_VER=$(curl -s https://api.github.com/repos/prometheus/alertmanager/releases/latest | grep tag_name | cut -d '"' -f4)
cd /tmp
curl -sLO https://github.com/prometheus/alertmanager/releases/download/${AM_VER}/alertmanager-${AM_VER#v}.linux-amd64.tar.gz
curl -sLO https://github.com/prometheus/alertmanager/releases/download/${AM_VER}/sha256sums.txt
sha256sum -c --ignore-missing sha256sums.txt
tar xzf alertmanager-${AM_VER#v}.linux-amd64.tar.gz
sudo install -m 0755 alertmanager-${AM_VER#v}.linux-amd64/alertmanager alertmanager-${AM_VER#v}.linux-amd64/amtool /usr/local/bin/
The config holds an SMTP password and a Slack webhook, so it should not be world readable. Write it to /tmp/alertmanager.yml first with your editor, then install it owned by root and readable by the alertmanager group only:
vim /tmp/alertmanager.ymlReplace the SMTP host, credentials, addresses and webhook URL with your own. You can leave the Slack receiver out if you don’t use Slack, but then delete the critical child route too, because a route that names a missing receiver fails the config check.
global:
  resolve_timeout: 5m
  smtp_smarthost: "smtp.example.com:587"
  smtp_from: "[email protected]"
  smtp_auth_username: "[email protected]"
  smtp_auth_password: "change-me"

route:
  receiver: email-ops
  group_by: ["alertname", "host"]
  group_wait: 30s
  group_interval: 5m
  repeat_interval: 4h
  routes:
    - matchers:
        - severity = "critical"
      receiver: slack-oncall
      repeat_interval: 1h

receivers:
  - name: email-ops
    email_configs:
      - to: "[email protected]"
        send_resolved: true

  - name: slack-oncall
    slack_configs:
      - api_url: "https://hooks.slack.com/services/T000/B000/XXXXXXXX"
        channel: "#oncall"
        send_resolved: true
        title: '{{ .Status | toUpper }}: {{ .CommonLabels.alertname }} on {{ .CommonLabels.host }}'
        text: '{{ range .Alerts }}{{ .Annotations.description }}{{ "\n" }}{{ end }}'

inhibit_rules:
  - source_matchers:
      - alertname = "HostUnreachable"
    target_matchers:
      - alertname =~ "SSHDown|ServicePortDown|WebsiteDown|NodeExporterDown"
    equal: ["host"]
The inhibit rule reads: while HostUnreachable fires for a host, mute SSHDown, ServicePortDown, WebsiteDown and NodeExporterDown for the same host. The equal: ["host"] line is the reason every target in prometheus.yml carries a host label. Without it, a ping failure on db01 would mute the website alert on web01 too. The group timings are Alertmanager’s defaults written out, except the shorter repeat for critical pages.
sudo install -m 0640 -o root -g alertmanager /tmp/alertmanager.yml /etc/alertmanager/alertmanager.yml
rm /tmp/alertmanager.yml
sudo amtool check-config /etc/alertmanager/alertmanager.yml
Run amtool with sudo here. As a normal user it fails with permission denied on the 0640 file, which looks like a config error but isn’t. A good file reports what it found:
Checking '/etc/alertmanager/alertmanager.yml'  SUCCESS
Found:
 - global config
 - route
 - 1 inhibit rules
 - 2 receivers
 - 0 templates
Now create the unit file.
sudo vim /etc/systemd/system/alertmanager.serviceThe empty --cluster.listen-address= turns off high availability gossip, which otherwise listens on port 9094 on every interface for peers you don’t have.
[Unit]
Description=Prometheus Alertmanager
Wants=network-online.target
After=network-online.target

[Service]
User=alertmanager
Group=alertmanager
ExecStart=/usr/local/bin/alertmanager \
  --config.file=/etc/alertmanager/alertmanager.yml \
  --storage.path=/var/lib/alertmanager \
  --web.listen-address=:9093 \
  --cluster.listen-address=
ExecReload=/bin/kill -HUP $MAINPID
Restart=on-failure

[Install]
WantedBy=multi-user.target
Start it and test where two sample alerts would go. amtool config routes test walks the routing tree with the labels you give it, so you can check the tree without waiting for a real outage.
sudo systemctl daemon-reload
sudo systemctl enable --now alertmanager
sudo amtool config routes test --config.file=/etc/alertmanager/alertmanager.yml alertname=HostUnreachable severity=critical host=db01
sudo amtool config routes test --config.file=/etc/alertmanager/alertmanager.yml alertname=SlowHTTPResponse severity=warning host=web01
sudo amtool config routes --config.file=/etc/alertmanager/alertmanager.yml
The critical alert lands on Slack, the warning falls through to email, and the tree shows the one child route:
slack-oncall
email-ops
Routing tree:
.
└── default-route  receiver: email-ops
    └── {severity="critical"}  receiver: slack-oncall
Prometheus already points at localhost:9093 from the alerting block, so nothing else needs to change there. The full list of matchers and receivers is in the Alertmanager configuration reference. One caveat from the lab: the webhook and SMTP server above are placeholders, so routing and inhibition were tested, but delivery to a real Slack workspace or mailbox was not.
Measure availability with PromQL
Because probe_success is 1 or 0, its average over a window is the fraction of probes that passed. Multiply by 100 for an availability percentage per target:
avg_over_time(probe_success[1h]) * 100For an SLA report, a percentage hides how long the outage was. This query counts failed probes over the last hour on a 15 second step and turns them into minutes of downtime:
sum_over_time((1 - probe_success)[1h:15s]) * 15 / 60We ran both right after the downtime drill at the end of this guide. The two queries told different stories about the same outage:
| Probe | Availability over [1h] | Downtime minutes |
|---|---|---|
| db01 ICMP | 66.15 | 5.5 |
| db01 SSH | 63.08 | 6.0 |
| db01 TCP 3306 | 63.08 | 6.0 |
| web01 HTTP | 64.62 | 5.75 |
| web01 ICMP and SSH | 100.0 | 0.0 |
Six minutes down in an hour is 90% available, not 63%. The catch is that the series were only about 17 minutes old when we queried, and avg_over_time divides by the samples that exist, not by the window you asked for. On a new target, or one added to Prometheus last week, a monthly availability figure is really “availability since we started looking”. Downtime minutes don’t have that problem, which is why we put them on SLA reports and keep the percentage for long-lived targets.

For a quick “is anything down on this host” panel, min by (host) (probe_success) returns 0 as soon as any probe on that host fails.
Import the Grafana dashboard
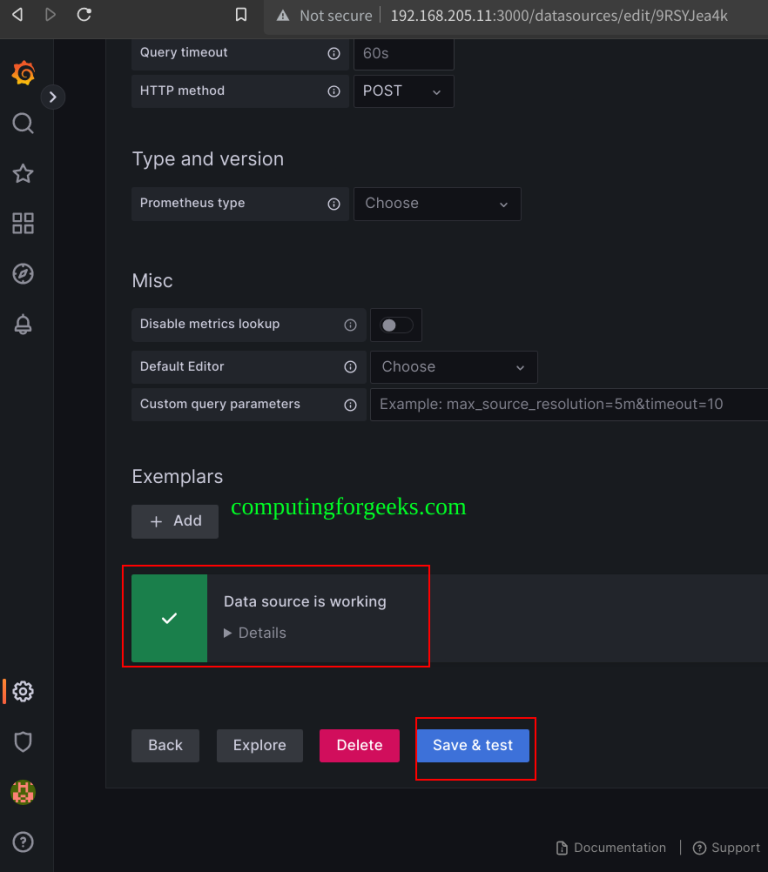
Grafana runs on mon01 with Prometheus added as a data source at http://localhost:9090. The Grafana install guide for Ubuntu covers both if you haven’t done them. We use community dashboard 7587, Prometheus Blackbox Exporter, because it builds its host picker from the instance label, which is exactly what our relabel sets. The popular 14928 expects a target label instead and showed empty panels against this config.
In Grafana, open Dashboards, then New and Import. The import page is easy to misread because the upload area takes most of the screen:
- Type 7587 into the Grafana.com dashboard URL or ID field.
- Click Load.

- 1Grafana.com dashboard URL or ID
- 2Load
The next screen asks which data source the dashboard’s queries should use. Pick your server in the Prometheus data source picker, then click Import:

- 1Prometheus data source
- 2Import
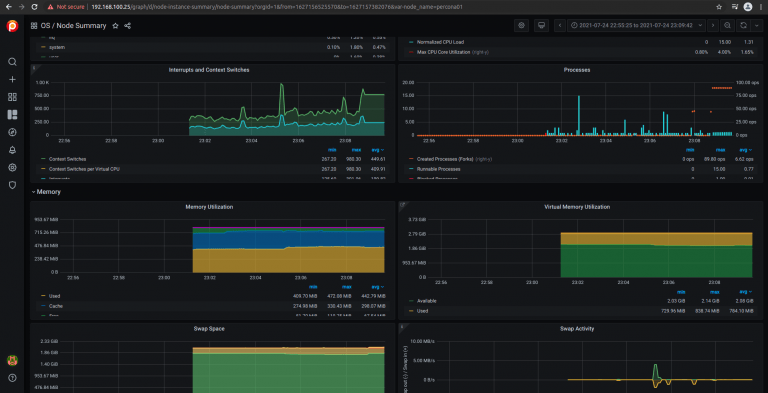
The dashboard opens with every probed instance, its status and probe duration. Pick a host in the target drop-down at the top, which the dashboard builds from the instance label, so you can see one host at a time. If the drop-down is empty, your probe jobs are missing the instance relabel step.

Dashboard 7587 was built for website checks, so its HTTP and SSL panels show N/A for the ICMP and TCP targets. That’s expected. Its old panel types are migrated automatically on import, and the status and duration rows work for every probe type. If you also watch public sites with certificates, our website uptime guide with blackbox_exporter covers SSL expiry probes and the panels that go with them.
Fix the probe errors you will hit
Both of these showed up on the first run in the lab, and both leave probe_success 0 on a host that is perfectly healthy.
Error: “listen ip4:icmp 0.0.0.0: socket: operation not permitted”
Every ICMP probe returns 0 and the debug=true output shows this line. The exporter runs as a non-root user without CAP_NET_RAW on a system where net.ipv4.ping_group_range is 1 0, which is the Ubuntu default:

Check the sysctl with sysctl net.ipv4.ping_group_range. The fix is the two capability lines in the unit file above, followed by sudo systemctl daemon-reload and a restart of blackbox_exporter. On db01 running Ubuntu 24.04, the same probe went from 0 without the capability to 1 with it. Running the exporter as root also works, but it hands a network-facing daemon far more than it needs.
Error: “dial tcp4 10.132.0.17:3306: connect: connection refused”
The TCP probe to MariaDB fails while the database is clearly running. MariaDB on Ubuntu listens on loopback only, as the shipped config shows:
grep -n '^bind-address' /etc/mysql/mariadb.conf.d/50-server.cnfLine 27 holds the loopback bind, so nothing outside db01 can open the port.
27:bind-address = 127.0.0.1If remote clients are supposed to reach the database, change the bind address and restart MariaDB. Do this only together with the ufw rule from the firewall section, which keeps 3306 closed to everything except mon01:
sudo sed -i 's/^bind-address.*/bind-address            = 0.0.0.0/' /etc/mysql/mariadb.conf.d/50-server.cnf
sudo systemctl restart mariadb
sudo ss -tlnp | grep 3306
The listener should now show 0.0.0.0:3306. Run the TCP probe from mon01 again and you should get 1, since the ufw rule already lets mon01 through. If it still fails, the ufw source address doesn’t match the address mon01 connects from.
LISTEN 0 80 0.0.0.0:3306 0.0.0.0:* users:(("mariadbd",pid=3614,fd=22))If the database is meant to stay local, don’t open it just to satisfy a probe. Drop the TCP 3306 job and watch the database from inside with mysqld_exporter, as in our MariaDB monitoring guide. The same approach fits other local-only services such as Redis.
Run a downtime drill before you trust it
An uptime setup that has never seen a real outage is a guess, so break something you can afford to break. We picked two failures that should produce different pages:
- nginx stopped on web01 at 19:55:35 UTC
- db01 shut down a few seconds later (the stop call returned at 19:56:44 UTC)
The first should give you one WebsiteDown page while web01 still answers ping and SSH. The second should give you one HostUnreachable page, with the db01 service alerts held back. Within a few minutes the Prometheus Alerts page showed both outages firing.

The question is what reached a human. Ask Alertmanager for the active alerts, then for the ones it is holding back.
amtool alert query --alertmanager.url=http://localhost:9093
amtool alert query --inhibited --alertmanager.url=http://localhost:9093
Two alerts are active, one per broken host, and the three db01 service alerts sit in the suppressed state:

The same split is visible in the Alertmanager web UI on port 9093. Tick the Inhibited checkbox in the filter bar to show the muted alerts next to the active ones:

Now look at the timestamps, because they show a race. SSHDown, ServicePortDown and NodeExporterDown on db01 all started at 19:58:19, but HostUnreachable only started at 19:58:49. The guest kept answering ping for about 30 seconds while its services were already gone during shutdown. For those 30 seconds nothing was inhibiting the service alerts. They stayed quiet only because group_wait: 30s holds a new group before its first notification, and HostUnreachable arrived inside that window. The Alertmanager log confirms that only two notifications were attempted, one per host:
sudo journalctl -u alertmanager --no-pager | grep "Notify for alerts failed"Both failed because the lab webhook is fake, which is the expected 404: no_team. What matters is the list: WebsiteDown and HostUnreachable, nothing else:
time=2026-11-11T19:58:20.806Z level=ERROR source=dispatch.go:642 msg="Notify for alerts failed" component=dispatcher aggrGroup="{}/{severity=\"critical\"}:{alertname=\"WebsiteDown\", host=\"web01\"}" num_alerts=1 receiver=slack-oncall err="slack-oncall/slack[0]: notify retry canceled due to unrecoverable error after 1 attempts: channel \"#oncall\": unexpected status code 404: no_team"
time=2026-11-11T19:59:19.963Z level=ERROR source=dispatch.go:642 msg="Notify for alerts failed" component=dispatcher aggrGroup="{}/{severity=\"critical\"}:{alertname=\"HostUnreachable\", host=\"db01\"}" num_alerts=1 receiver=slack-oncall err="slack-oncall/slack[0]: notify retry canceled due to unrecoverable error after 1 attempts: channel \"#oncall\": unexpected status code 404: no_team"
Two rules come out of this. Keep the inhibiting alert’s for equal to or shorter than the alerts it mutes, and keep group_wait at least as long as the gap you measure between them. If you shorten group_wait to 10 seconds to page faster, the three db01 service alerts would have gone out before HostUnreachable existed.
Recovery is the other half of the drill. After starting nginx and booting db01 again, every probe returned to 1 and the HostRebooted warning fired at 20:02:19, so a host that bounced overnight still leaves a trace in the morning. The probe graph shows both outages and both recoveries:

That’s the whole setup: probes from outside, one job per probe type, a host label on everything, and inhibition so a dead server sends one page. Run the drill again whenever you change for durations or Alertmanager timings, because the race between the ping alert and the service alerts is the part that breaks silently. The same pattern extends to other services, as in our BIND DNS monitoring guide, and the blackbox_exporter README lists the DNS, gRPC and WebSocket probers this guide didn’t need.