QuestDB ships a Prometheus endpoint on port 9003, but the endpoint is off by default, and the port still answers with HTTP 200 while it is off. Prometheus then marks the target down with a parse error, and nothing in the QuestDB logs tells you why. This guide turns the endpoint on, scrapes it, adds alert rules that matter for a WAL-based database and puts the numbers on a Grafana dashboard.
We pushed 95 million rows through QuestDB over 15 minutes so the panels show real ingest and memory figures. Everything below ran on Ubuntu 26.04 LTS with QuestDB 10.2.0, Prometheus 3.16.0 and Grafana 13.3.0 in November 2026, on one 4 vCPU, 16 GB host.

Prometheus pulls from QuestDB, never the other way round, and Grafana reads from both. Only ports 3000 and 9090 face your admin network, because the QuestDB ports take writes and SQL with no login.
Install QuestDB as a systemd service
The “rt” tarball bundles its own Java runtime, so you do not need a JDK on the host. Before you start, make sure the server has these.
- Ubuntu on x86-64 with sudo access
- curl, jq and python3
- 4 GB RAM for a lab, 16 GB or more for real ingest
The RAM figure is a floor. The QuestDB heap stays small, but the server memory-maps table files, so page cache is what makes queries fast, and that grows with the data you keep hot. If you already run QuestDB in containers, the QuestDB Docker setup exposes the same 9003 port and everything from the metrics step onward applies unchanged.
Create a system user first, because the service should never run as root. Then pull the latest release tag from the GitHub API, so the download URL still works when you rerun these steps after the next release.
sudo apt-get install -y curl jq python3
sudo useradd --system --no-create-home --shell /usr/sbin/nologin questdb
QDB_VER=$(curl -s https://api.github.com/repos/questdb/questdb/releases/latest | jq -r .tag_name)
echo "${QDB_VER}"
curl -fSL -o /tmp/questdb.tar.gz "https://github.com/questdb/questdb/releases/download/${QDB_VER}/questdb-${QDB_VER}-rt-linux-x86-64.tar.gz"
Make sure the echo printed a version. Unauthenticated GitHub API calls are rate limited per IP, and a refused call leaves the variable as null and the download fails with a 404. The archive is about 92 MB. Unpack it into /opt/questdb and give QuestDB its own data directory under /var/lib, so you can swap the binaries on upgrade without touching tables or server.conf.
sudo tar -xzf /tmp/questdb.tar.gz -C /opt
sudo mv "/opt/questdb-${QDB_VER}-rt-linux-x86-64" /opt/questdb
sudo mkdir -p /var/lib/questdb
sudo chown -R questdb:questdb /var/lib/questdb
Now write the unit file, since the tarball ships a shell launcher and no systemd service.
sudo vim /etc/systemd/system/questdb.servicePaste the following. The -n at the end of ExecStart is not optional, and the next subsection shows what happens without it.
[Unit]
Description=QuestDB
After=network.target

[Service]
Type=simple
User=questdb
Group=questdb
ExecStart=/opt/questdb/bin/questdb.sh start -d /var/lib/questdb -n
LimitNOFILE=1048576
Restart=on-failure

[Install]
WantedBy=multi-user.target
Reload systemd, start the service and confirm all four listeners are up.
sudo systemctl daemon-reload
sudo systemctl enable --now questdb
systemctl status questdb --no-pager | head -9
sudo ss -tlnp | grep -E "9000|9003|8812|9009"
You should see active (running) and the Java process bound to 8812 (PostgreSQL wire), 9000 (web console, REST and ILP over HTTP), 9003 (health and metrics) and 9009 (ILP over TCP):

Idle, the service sat at 476.5M of memory with 47 tasks. That number climbs fast under write load, which is the whole reason to monitor it. During the load test later in this guide the same unit reached 2.8G, so a host sized from the idle figure would run out of headroom long before any client reported an error. Note the 0.0.0.0 binds too: port 9000 takes writes and SQL with no login, so on a host with a public address apply the firewall rules from the last section now, not at the end.
questdb.service: inactive (dead) with status=0/SUCCESS
Our first unit had no -n, and the service died about four seconds after starting while systemd reported a clean exit:
○ questdb.service - QuestDB
     Loaded: loaded (/etc/systemd/system/questdb.service; enabled; preset: enabled)
     Active: inactive (dead) since Thu 2026-11-12 09:03:16 UTC; 3s ago
   Duration: 4.474s
    Process: 2519 ExecStart=/opt/questdb/bin/questdb.sh start -d /var/lib/questdb (code=exited, status=0/SUCCESS)
   Main PID: 2519 (code=exited, status=0/SUCCESS)
   Mem peak: 498.4M
Without -n, questdb.sh launched Java and exited 0, so systemd decided the main process had finished and tore down the cgroup with Java inside it. The usage text of the script lists -n as “Disable HUP handler”, and with it the launcher stays alive as the main PID. Add the flag, run sudo systemctl daemon-reload and restart. When you see a clean exit on any wrapper-script service, suspect this pattern first, because systemd is doing exactly what the unit told it to.
Turn on the QuestDB metrics endpoint
Port 9003 is up already, but it serves only a health string until you change one setting. Curl it before you touch anything so you know what “off” looks like, because you’ll see the same reply later if a config rewrite drops the setting.
curl -s http://127.0.0.1:9003/metrics; echoIt returns HTTP 200 with a single line, which is why a quick status-code check fools people.
Status: HealthyThe switch lives in server.conf inside the data directory, commented out as #metrics.enabled=false under the “Metrics settings” banner. Appending the setting is quicker than hunting for that line in a 2,000-line file, and running tee as the questdb user keeps the file owned by the service.
echo 'metrics.enabled=true' | sudo -u questdb tee -a /var/lib/questdb/conf/server.conf
sudo systemctl restart questdb
curl -s http://127.0.0.1:9003/metrics | head -12
After the restart the endpoint speaks Prometheus text format, one # TYPE line per metric followed by its value.

An idle scrape was 21,710 bytes carrying 235 questdb_ samples, and under heavy load it only grew to 21,838 bytes. The sample count didn’t change between idle and 100k rows a second, so this target adds a small, steady cardinality to Prometheus. The full list of metric names and what each means is in the QuestDB logging and metrics docs.
Install Prometheus and scrape QuestDB
We run Prometheus from the upstream tarball so the binary matches the current release notes and the flags in the unit below. If you’d rather follow a fuller walkthrough with its own hardening, the Prometheus server install on Ubuntu covers it; the scrape job below drops into either setup.
sudo useradd --system --no-create-home --shell /usr/sbin/nologin prometheus
sudo mkdir -p /etc/prometheus/rules /var/lib/prometheus
sudo chown prometheus:prometheus /var/lib/prometheus
PROM_VER=$(curl -s https://api.github.com/repos/prometheus/prometheus/releases/latest | jq -r .tag_name | sed 's/^v//')
curl -fsSL -o /tmp/prometheus.tar.gz "https://github.com/prometheus/prometheus/releases/download/v${PROM_VER}/prometheus-${PROM_VER}.linux-amd64.tar.gz"
tar -xzf /tmp/prometheus.tar.gz -C /tmp
sudo install -m 0755 "/tmp/prometheus-${PROM_VER}.linux-amd64/prometheus" "/tmp/prometheus-${PROM_VER}.linux-amd64/promtool" /usr/local/bin/
Next comes the main config in /etc/prometheus.
sudo vim /etc/prometheus/prometheus.ymlAdd a questdb job pointing at port 9003. The env label is there so alerts and dashboards can tell a lab box from production later.
global:
  scrape_interval: 15s

rule_files:
  - "rules/*.yml"

scrape_configs:
  - job_name: prometheus
    static_configs:
      - targets: ["localhost:9090"]

  - job_name: questdb
    static_configs:
      - targets: ["127.0.0.1:9003"]
        labels:
          env: lab
Then create the service unit, so Prometheus runs as its own user and comes back after a crash.
sudo vim /etc/systemd/system/prometheus.serviceRetention is set to 15 days here, which covers two weekly cycles of ingest. Raise it if you want month-over-month comparisons, because a 15-day window can’t show a slow monthly trend, and size the disk for it. The --web.enable-lifecycle flag lets you reload config with a POST to /-/reload, so you won’t need a full restart every time you edit a rule. It also enables /-/quit with no authentication, which is one more reason to keep 9090 limited to a small admin subnet.
[Unit]
Description=Prometheus
After=network-online.target
Wants=network-online.target

[Service]
User=prometheus
Group=prometheus
Type=simple
ExecStart=/usr/local/bin/prometheus \
  --config.file=/etc/prometheus/prometheus.yml \
  --storage.tsdb.path=/var/lib/prometheus \
  --storage.tsdb.retention.time=15d \
  --web.listen-address=0.0.0.0:9090 \
  --web.enable-lifecycle
Restart=on-failure

[Install]
WantedBy=multi-user.target
Validate the config before you start anything. A YAML indent mistake here otherwise shows up as a crash loop in the journal, so promtool saves you a round of journalctl reading.
promtool check config /etc/prometheus/prometheus.ymlOnce the rules file from the next section exists, promtool checks it too, which is the run shown here.

Start Prometheus and ask its API for the target state.
sudo systemctl daemon-reload
sudo systemctl enable --now prometheus
curl -s 'http://127.0.0.1:9090/api/v1/targets' | jq -r '.data.activeTargets[] | [.labels.job, .health, .lastScrapeDuration, .scrapeUrl] | @tsv'
Both jobs should read up. The QuestDB scrape took 31 ms, so a 15-second interval costs the database almost nothing. If the questdb line shows down instead, jump to the parse error below before you change anything else, because it’s almost always the metrics switch.
prometheus	up	0.039089008	http://localhost:9090/metrics
questdb	up	0.03149946	http://127.0.0.1:9003/metrics
You can see the same thing in the web UI at http://10.0.1.50:9090/targets, with the env="lab" label attached.

For the sample count and scrape duration as plain numbers, query the API with --data-urlencode so curl leaves the braces alone.
curl -s -G 'http://127.0.0.1:9090/api/v1/query' --data-urlencode 'query=up{job="questdb"}' | jq -c '.data.result[] | {metric, value}'
curl -s -G 'http://127.0.0.1:9090/api/v1/query' --data-urlencode 'query=scrape_samples_scraped{job="questdb"}' | jq -c '.data.result[] | {metric, value}'
curl -s -G 'http://127.0.0.1:9090/api/v1/query' --data-urlencode 'query=scrape_duration_seconds{job="questdb"}' | jq -c '.data.result[] | {metric, value}'
The second field of each value pair is the number: up is 1, we got 235 samples, matching the curl count above, and the same 31 ms scrape duration the targets API reported.

If those come back empty, the target never scraped, so check the error below before you look anywhere else.
Target down: strconv.ParseFloat: parsing “Healthy”: invalid syntax
We reproduced this by setting metrics.enabled=false again and restarting QuestDB. Port 9003 kept answering, so the scrape succeeded at the HTTP level and failed at the parser.

Prometheus reads “Status: Healthy” as a metric called Status: with the value “Healthy”, which is not a float. The fix is always the same: metrics.enabled=true in /var/lib/questdb/conf/server.conf and a restart. The target went back to up with an empty error on the next scrape.
One more trap from the same test: curl 'http://127.0.0.1:9090/api/v1/query?query=up{job="questdb"}' fails with jq: error ... Cannot iterate over null because curl treats the braces as a glob. Pass the query with --data-urlencode instead, as the queries above do.
Add alert rules for QuestDB
Six rules cover the failures we’d actually want to be woken for: the endpoint disappearing, the heap filling, unhandled errors, a WAL table getting suspended, WAL apply falling behind and native memory running away. Create the rules file.
sudo vim /etc/prometheus/rules/questdb_alerts.ymlAdd the following rules. The 6 GiB native memory threshold suits a 16 GB host, so scale it to roughly 40% of RAM on yours.
groups:
  - name: questdb
    rules:
      - alert: QuestDBDown
        expr: up{job="questdb"} == 0
        for: 2m
        labels:
          severity: critical
        annotations:
          summary: "QuestDB metrics endpoint {{ $labels.instance }} is down"

      - alert: QuestDBHeapHigh
        expr: (questdb_memory_jvm_total - questdb_memory_jvm_free) / questdb_memory_jvm_max > 0.85
        for: 5m
        labels:
          severity: warning
        annotations:
          summary: "QuestDB JVM heap above 85% of max on {{ $labels.instance }}"

      - alert: QuestDBUnhandledErrors
        expr: increase(questdb_unhandled_errors_total[5m]) > 0
        labels:
          severity: warning
        annotations:
          summary: "QuestDB logged unhandled errors in the last 5 minutes"

      - alert: QuestDBTablesSuspended
        expr: questdb_suspended_tables > 0
        for: 1m
        labels:
          severity: critical
        annotations:
          summary: "{{ $value }} QuestDB WAL table(s) suspended"

      - alert: QuestDBWalApplyLag
        expr: questdb_wal_apply_seq_txn - questdb_wal_apply_writer_txn > 1000
        for: 5m
        labels:
          severity: warning
        annotations:
          summary: "WAL apply is {{ $value }} transactions behind the sequencer"

      - alert: QuestDBNativeMemoryHigh
        expr: questdb_memory_mem_used > 6 * 1024 * 1024 * 1024
        for: 10m
        labels:
          severity: warning
        annotations:
          summary: "QuestDB native memory above 6 GiB on {{ $labels.instance }}"
A suspended table is the one to treat as critical. QuestDB stops applying WAL transactions to it, so readers see the data freeze even though nothing else on the dashboard looks wrong. Once you’ve fixed the cause, ALTER TABLE sensors RESUME WAL; restarts it, and SELECT * FROM wal_tables(); shows which tables are suspended. Check the file and restart Prometheus.
promtool check rules /etc/prometheus/rules/questdb_alerts.yml
sudo systemctl restart prometheus
curl -s http://127.0.0.1:9090/api/v1/rules | jq -c ".data.groups[].rules[] | {name, health, state}"
Twenty seconds after the restart every rule still reported health: unknown. That is not a broken rule. It has not been evaluated yet, and with no evaluation_interval set Prometheus uses its one-minute default, so give it a minute before you go hunting. On the next check all six read like this:
{"name":"QuestDBDown","health":"ok","state":"inactive"}
{"name":"QuestDBHeapHigh","health":"ok","state":"inactive"}
{"name":"QuestDBUnhandledErrors","health":"ok","state":"inactive"}
{"name":"QuestDBTablesSuspended","health":"ok","state":"inactive"}
{"name":"QuestDBWalApplyLag","health":"ok","state":"inactive"}
{"name":"QuestDBNativeMemoryHigh","health":"ok","state":"inactive"}
The Alerts page in the Prometheus UI lists the same group, and it’s the first place you’ll look when something fires.

Rules only fire inside Prometheus. To get them to email or chat, wire up Alertmanager as described in Prometheus email alerts with Alertmanager and add its address under an alerting: block in prometheus.yml. Until you do, a firing rule only turns red on this page, so nobody hears about a suspended table at 3 a.m.
Load QuestDB and read the numbers
A dashboard on an idle database proves nothing, because every panel is a flat line and every alert stays green whether the expressions are right or not. So we wrote a small load generator that posts InfluxDB line protocol to the HTTP /write endpoint in 5,000-row batches. It uses only the Python standard library, so you can run it on the database host without installing anything.
vim ~/ilp_load.pyThe script takes a duration in seconds and a batch size, spreads rows across 100 devices and stops on the first HTTP error.
#!/usr/bin/env python3
import sys
import time
import random
import urllib.request
import urllib.error

URL = "http://127.0.0.1:9000/write"
DURATION = int(sys.argv[1]) if len(sys.argv) > 1 else 60
BATCH = int(sys.argv[2]) if len(sys.argv) > 2 else 5000

def build_batch(n):
    ts = time.time_ns()
    lines = []
    for i in range(n):
        dev = i % 100
        temp = round(random.uniform(15.0, 35.0), 2)
        hum = round(random.uniform(30.0, 80.0), 2)
        lines.append(f"sensors,device=dev-{dev} temp={temp},humidity={hum} {ts + i}")
    return ("\n".join(lines) + "\n").encode()

sent = 0
start = time.time()
while time.time() - start < DURATION:
    req = urllib.request.Request(URL, data=build_batch(BATCH), method="POST")
    try:
        with urllib.request.urlopen(req, timeout=30) as resp:
            if resp.status != 204:
                print("unexpected status", resp.status)
    except urllib.error.HTTPError as e:
        print("HTTP error", e.code, e.read().decode())
        break
    sent += BATCH

elapsed = time.time() - start
print(f"sent {sent} rows in {elapsed:.1f}s ({sent / elapsed:.0f} rows/sec)")
Run a five-second smoke test first. QuestDB creates the sensors table on the first write, so you do not need any DDL.
python3 ~/ilp_load.py 5 5000A single Python client managed a little over 100,000 rows a second.

That ceiling is the client, not QuestDB, because WAL apply on the server ran at about six million rows a second during the same test. Next, leave the generator running for 15 minutes in the background so Prometheus has a real curve to draw.
nohup python3 ~/ilp_load.py 900 5000 > ~/ilp_load.out 2>&1 &It finished with sent 94845000 rows in 900.0s (105380 rows/sec), and select count() from sensors returned 95,375,000 including the smoke test, 953,750 rows per device. While it ran we pulled the figures below from Prometheus, systemd and ps, so you have a baseline to compare your own box against:
| Measurement | Source | Value under load |
|---|---|---|
| Scrape size | curl :9003/metrics | wc -c | 21,838 bytes, 235 samples |
| Scrape duration | scrape_duration_seconds | 0.031 s |
| Ingest rate | rate(questdb_committed_rows_total[1m]) | 72,111 to 104,333 rows/s |
| Commits | rate(questdb_commits_total[1m]) | 14.4 per second |
| WAL apply | questdb_wal_apply_rows_per_second | 6,103,596 rows/s |
| JVM heap used / max | questdb_memory_jvm_* | 203 MiB of 3.47 GiB |
| Native memory | questdb_memory_mem_used | 1.28 GiB |
| Process RSS | questdb_memory_rss | 1.81 GiB |
| Unit memory | systemctl status questdb | 2.8G, 48 tasks |
| Prometheus RSS | ps | 135 MiB |
| Grafana RSS | ps | 414 MiB |
Two readings matter here. The heap barely moved, so QuestDBHeapHigh will stay quiet on a write-heavy box. Native memory and RSS are where growth shows, which is why we alert on questdb_memory_mem_used. And the 72k sample is lower than the client’s 105k because WAL commits land in bursts, so a one-minute rate swings between scrapes. Use a 5m window on alerting expressions that compare against ingest.
Here is the ingest rate graphed in Prometheus while the load ran.

The memory queries that fed the table came straight from the Prometheus API.

The 3.47 GiB heap max is about a quarter of the RAM on the host, the JVM default when no -Xmx is given. Leave it alone unless the heap alert actually fires, because a bigger heap takes memory away from the page cache that QuestDB queries depend on.
ILP HTTP 400: field value is invalid
Over HTTP, QuestDB rejects a bad line with a JSON body that names the field and the line number, so your client logs tell you exactly what broke. Here is a string where a float belongs.
curl -s -i -X POST http://127.0.0.1:9000/write --data-binary 'sensors,device=dev-1 temp=oops,humidity=50 1'The response is a 400 pointing straight at temp:
HTTP/1.1 400 Bad request
Server: questDB/1.0
Content-Type: application/json; charset=utf-8

{"code":"invalid","message":"failed to parse line protocol:errors encountered on line(s):\nerror in line 1: Could not parse entire line, field value is invalid. Field: temp; value: oops","line":1,"errorId":"f5e4363f99a5-1"}
The confusing variant is a space where the comma between table and tag should be, sensors device=dev-1 temp=1.5. QuestDB then parses device=dev-1 as a field and complains Field: device; value: dev-1, so the message blames the tag, not the missing comma. Our generator prints the body and stops on the first 400, and that is the behaviour you want in your own clients, because a silent retry loop just sends the same bad line again.
Connect Grafana to Prometheus
Grafana comes from its own apt repository. The Grafana install on Ubuntu goes deeper on SSL and reverse proxying. For this setup you only need the repository and the package.
sudo apt-get install -y apt-transport-https wget gpg
sudo mkdir -p /etc/apt/keyrings
wget -q -O - https://apt.grafana.com/gpg.key | gpg --dearmor | sudo tee /etc/apt/keyrings/grafana.gpg > /dev/null
echo "deb [signed-by=/etc/apt/keyrings/grafana.gpg] https://apt.grafana.com stable main" | sudo tee /etc/apt/sources.list.d/grafana.list
sudo apt-get update
sudo apt-get install -y grafana
sudo systemctl daemon-reload
sudo systemctl enable --now grafana-server
Set an admin password from the shell rather than the first-login prompt, since we’ll reuse it for API calls. Pick your own value for the variable, and keep it out of your shell history on a shared box. The API route matters here because it makes the data sources and dashboard reproducible, so you can rebuild the whole Grafana side from this page in a couple of minutes.
export GRAFANA_PASS='Qdb-Graf4na-Lab'
sudo grafana cli --homepath /usr/share/grafana admin reset-admin-password "${GRAFANA_PASS}"
After a screen of startup log lines it ends with Admin password changed successfully. Now create the Prometheus data source with a fixed UID, because the dashboard JSON below refers to it by that UID and the panels stay empty if it differs.
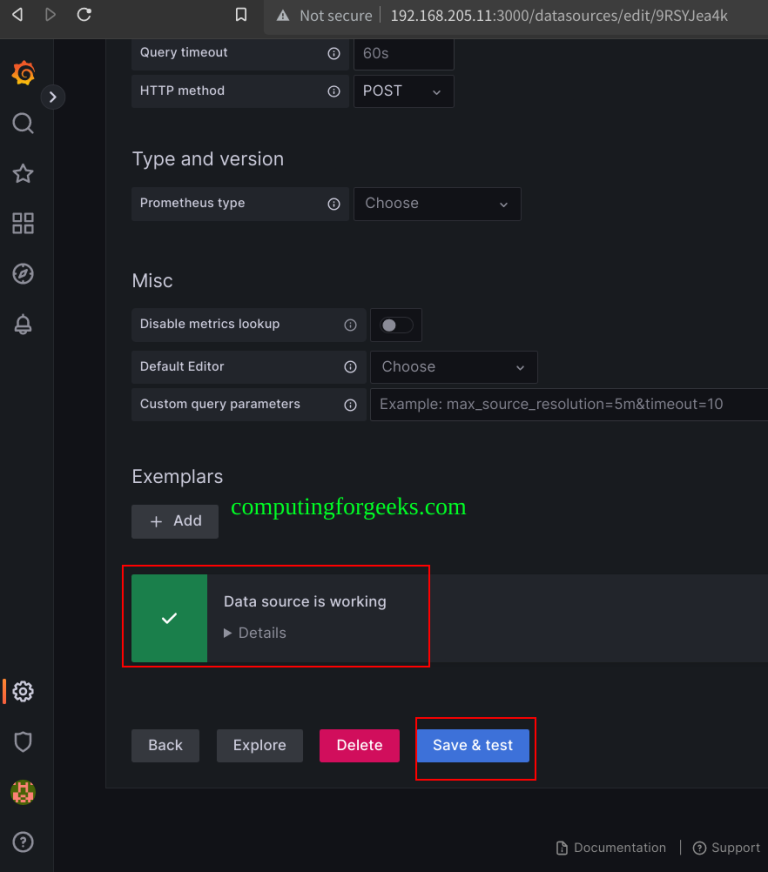
curl -s -u "admin:${GRAFANA_PASS}" -X POST -H 'Content-Type: application/json' http://127.0.0.1:3000/api/datasources -d '{"name":"Prometheus","uid":"prometheus","type":"prometheus","access":"proxy","url":"http://localhost:9090","isDefault":true}' | jq -c '.message'The API answers "Datasource added". To confirm it from the browser, log in at http://10.0.1.50:3000, open Connections > Data sources > Prometheus and check the Prometheus server URL:

It reads http://localhost:9090 because the Grafana backend makes the request, not your browser. Put Prometheus on another host and this is the field you change. Scroll down, click Save & test and wait for the Success message:

- 1Save & test
- 2Success message
“Successfully queried the Prometheus API” means Grafana reached Prometheus and ran a query. It says nothing about QuestDB yet, and proving that is the job of the dashboard.
Import the QuestDB dashboard
We built nine panels from the metrics that actually moved during the load test, and the panel queries match the alert rules so a firing alert has a graph to go with it. Save the JSON to a file:
vim ~/questdb-dashboard.jsonPaste the dashboard exactly as we imported it.
{
  "uid": "questdb-overview",
  "title": "QuestDB Overview",
  "tags": [
    "questdb"
  ],
  "timezone": "browser",
  "schemaVersion": 41,
  "refresh": "10s",
  "time": {
    "from": "now-15m",
    "to": "now"
  },
  "panels": [
    {
      "id": 1,
      "title": "Ingest rate (rows/s)",
      "type": "timeseries",
      "datasource": {
        "type": "prometheus",
        "uid": "prometheus"
      },
      "gridPos": {
        "x": 0,
        "y": 0,
        "w": 12,
        "h": 8
      },
      "targets": [
        {
          "refId": "A",
          "datasource": {
            "type": "prometheus",
            "uid": "prometheus"
          },
          "expr": "rate(questdb_committed_rows_total[1m])",
          "legendFormat": "committed rows/s"
        }
      ],
      "fieldConfig": {
        "defaults": {
          "unit": "rps"
        },
        "overrides": []
      }
    },
    {
      "id": 2,
      "title": "Commits per second",
      "type": "timeseries",
      "datasource": {
        "type": "prometheus",
        "uid": "prometheus"
      },
      "gridPos": {
        "x": 12,
        "y": 0,
        "w": 12,
        "h": 8
      },
      "targets": [
        {
          "refId": "A",
          "datasource": {
            "type": "prometheus",
            "uid": "prometheus"
          },
          "expr": "rate(questdb_commits_total[1m])",
          "legendFormat": "commits/s"
        },
        {
          "refId": "B",
          "datasource": {
            "type": "prometheus",
            "uid": "prometheus"
          },
          "expr": "rate(questdb_o3_commits_total[1m])",
          "legendFormat": "out-of-order commits/s"
        }
      ],
      "fieldConfig": {
        "defaults": {
          "unit": "ops"
        },
        "overrides": []
      }
    },
    {
      "id": 3,
      "title": "JVM heap used vs max",
      "type": "timeseries",
      "datasource": {
        "type": "prometheus",
        "uid": "prometheus"
      },
      "gridPos": {
        "x": 0,
        "y": 8,
        "w": 12,
        "h": 8
      },
      "targets": [
        {
          "refId": "A",
          "datasource": {
            "type": "prometheus",
            "uid": "prometheus"
          },
          "expr": "questdb_memory_jvm_total - questdb_memory_jvm_free",
          "legendFormat": "heap used"
        },
        {
          "refId": "B",
          "datasource": {
            "type": "prometheus",
            "uid": "prometheus"
          },
          "expr": "questdb_memory_jvm_max",
          "legendFormat": "heap max"
        }
      ],
      "fieldConfig": {
        "defaults": {
          "unit": "bytes"
        },
        "overrides": []
      }
    },
    {
      "id": 4,
      "title": "Native memory",
      "type": "timeseries",
      "datasource": {
        "type": "prometheus",
        "uid": "prometheus"
      },
      "gridPos": {
        "x": 12,
        "y": 8,
        "w": 12,
        "h": 8
      },
      "targets": [
        {
          "refId": "A",
          "datasource": {
            "type": "prometheus",
            "uid": "prometheus"
          },
          "expr": "questdb_memory_mem_used",
          "legendFormat": "tracked native memory"
        },
        {
          "refId": "B",
          "datasource": {
            "type": "prometheus",
            "uid": "prometheus"
          },
          "expr": "questdb_memory_rss",
          "legendFormat": "process RSS"
        }
      ],
      "fieldConfig": {
        "defaults": {
          "unit": "bytes"
        },
        "overrides": []
      }
    },
    {
      "id": 5,
      "title": "WAL apply rows per second",
      "type": "timeseries",
      "datasource": {
        "type": "prometheus",
        "uid": "prometheus"
      },
      "gridPos": {
        "x": 0,
        "y": 16,
        "w": 12,
        "h": 8
      },
      "targets": [
        {
          "refId": "A",
          "datasource": {
            "type": "prometheus",
            "uid": "prometheus"
          },
          "expr": "questdb_wal_apply_rows_per_second",
          "legendFormat": "apply rows/s"
        }
      ],
      "fieldConfig": {
        "defaults": {
          "unit": "rps"
        },
        "overrides": []
      }
    },
    {
      "id": 6,
      "title": "Query rate",
      "type": "timeseries",
      "datasource": {
        "type": "prometheus",
        "uid": "prometheus"
      },
      "gridPos": {
        "x": 12,
        "y": 16,
        "w": 12,
        "h": 8
      },
      "targets": [
        {
          "refId": "A",
          "datasource": {
            "type": "prometheus",
            "uid": "prometheus"
          },
          "expr": "rate(questdb_json_queries_total[1m])",
          "legendFormat": "REST /exec queries/s"
        },
        {
          "refId": "B",
          "datasource": {
            "type": "prometheus",
            "uid": "prometheus"
          },
          "expr": "rate(questdb_pg_wire_queries_total[1m])",
          "legendFormat": "PG wire queries/s"
        }
      ],
      "fieldConfig": {
        "defaults": {
          "unit": "ops"
        },
        "overrides": []
      }
    },
    {
      "id": 7,
      "title": "Unhandled errors",
      "type": "stat",
      "datasource": {
        "type": "prometheus",
        "uid": "prometheus"
      },
      "gridPos": {
        "x": 0,
        "y": 24,
        "w": 6,
        "h": 5
      },
      "targets": [
        {
          "refId": "A",
          "datasource": {
            "type": "prometheus",
            "uid": "prometheus"
          },
          "expr": "questdb_unhandled_errors_total",
          "legendFormat": "unhandled errors"
        }
      ],
      "fieldConfig": {
        "defaults": {
          "unit": "none",
          "thresholds": {
            "mode": "absolute",
            "steps": [
              {
                "color": "green",
                "value": null
              },
              {
                "color": "red",
                "value": 1
              }
            ]
          }
        },
        "overrides": []
      },
      "options": {
        "reduceOptions": {
          "calcs": [
            "lastNotNull"
          ]
        },
        "colorMode": "value"
      }
    },
    {
      "id": 8,
      "title": "Suspended tables",
      "type": "stat",
      "datasource": {
        "type": "prometheus",
        "uid": "prometheus"
      },
      "gridPos": {
        "x": 6,
        "y": 24,
        "w": 6,
        "h": 5
      },
      "targets": [
        {
          "refId": "A",
          "datasource": {
            "type": "prometheus",
            "uid": "prometheus"
          },
          "expr": "questdb_suspended_tables",
          "legendFormat": "suspended tables"
        }
      ],
      "fieldConfig": {
        "defaults": {
          "unit": "none",
          "thresholds": {
            "mode": "absolute",
            "steps": [
              {
                "color": "green",
                "value": null
              },
              {
                "color": "red",
                "value": 1
              }
            ]
          }
        },
        "overrides": []
      },
      "options": {
        "reduceOptions": {
          "calcs": [
            "lastNotNull"
          ]
        },
        "colorMode": "value"
      }
    },
    {
      "id": 9,
      "title": "Scrape duration",
      "type": "timeseries",
      "datasource": {
        "type": "prometheus",
        "uid": "prometheus"
      },
      "gridPos": {
        "x": 12,
        "y": 24,
        "w": 12,
        "h": 5
      },
      "targets": [
        {
          "refId": "A",
          "datasource": {
            "type": "prometheus",
            "uid": "prometheus"
          },
          "expr": "scrape_duration_seconds{job=\"questdb\"}",
          "legendFormat": "scrape duration"
        }
      ],
      "fieldConfig": {
        "defaults": {
          "unit": "s"
        },
        "overrides": []
      }
    }
  ]
}
Import it through the API. The jq call wraps the file in the envelope the dashboards API expects, with overwrite set so you can rerun it after editing panels.
jq '{dashboard: ., overwrite: true}' ~/questdb-dashboard.json | curl -s -u "admin:${GRAFANA_PASS}" -X POST -H 'Content-Type: application/json' http://127.0.0.1:3000/api/dashboards/db -d @- | jq -c .A "status":"success" with the URL means it is live.
{"folderUid":"","id":4114868772216832,"slug":"questdb-overview","status":"success","uid":"questdb-overview","url":"/d/questdb-overview/questdb-overview","version":1}Open /d/questdb-overview/questdb-overview while the load generator runs. Ingest sits around 100k rows a second, commits run at 20 or more a second, and native memory climbs while the heap line stays flat against its max:

The two stat panels, unhandled errors and suspended tables, should read 0 forever. If either changes, the matching alert rule has already started its timer. Running Grafana in a container instead? The Grafana Docker container guide works with the same data source and import calls; point the URL at the Prometheus host instead of localhost.
Query QuestDB tables from Grafana
Prometheus tells you how the database is doing, not what’s in it. To chart the data itself, add QuestDB as a PostgreSQL data source on port 8812, because QuestDB speaks the PostgreSQL wire protocol and the bundled Grafana plugin connects to it without extra plugins. The credentials below are the shipped QuestDB defaults, admin and quest, so change them before this leaves a lab. QuestDB also publishes its own Grafana data source plugin and recommends it over the PostgreSQL one. We tested the PostgreSQL route because it ships with Grafana and needs no plugin install.
curl -s -u "admin:${GRAFANA_PASS}" -X POST -H 'Content-Type: application/json' http://127.0.0.1:3000/api/datasources -d '{"name":"QuestDB","uid":"questdb-pg","type":"grafana-postgresql-datasource","access":"proxy","url":"127.0.0.1:8812","user":"admin","database":"qdb","secureJsonData":{"password":"quest"},"jsonData":{"sslmode":"disable","postgresVersion":1200,"timescaledb":false}}' | jq -c '.datasource | {uid,name,type,url,database,user}'
curl -s -u "admin:${GRAFANA_PASS}" -X POST -H 'Content-Type: application/json' http://127.0.0.1:3000/api/datasources/uid/questdb-pg/health | jq -c .
The health call is the check that matters:
{"uid":"questdb-pg","name":"QuestDB","type":"grafana-postgresql-datasource","url":"127.0.0.1:8812","database":"qdb","user":"admin"}
{"message":"Database Connection OK","status":"OK"}
In Explore, pick the QuestDB source, switch the editor to code and combine SAMPLE BY with the Grafana time macro.
SELECT timestamp AS time, avg(temp) AS avg_temp FROM sensors WHERE $__timeFilter(timestamp) SAMPLE BY 10sTen-second averages across 100 random devices hover around 25, the midpoint of the 15 to 35 range in the generator, which is a quick sanity check that the rows landed intact. The $__timeFilter macro also matters for speed, because QuestDB only opens the partitions inside the dashboard time range instead of scanning all 95 million rows.

For a Kubernetes deployment the data source URL becomes the service name on 8812. The QuestDB on Kubernetes guide shows the service it creates.
db query error: ERROR: Invalid column: m (SQLSTATE 00000)
We hit this testing the query through Grafana’s /api/ds/query endpoint with dateadd('m', -2, now()) inside a single-quoted curl -d argument. The shell closed the quote at 'm', so QuestDB received dateadd(m, -2, now()) and read m as a column. Put the request JSON in a file and send it with -d @q.json, or use $__timeFilter(timestamp) as above, which needs no inner quotes. With the file, the same query returned 13 rows and status 200.
Close the ports before production
By default QuestDB binds all four ports on 0.0.0.0, and port 9000 accepts writes and SQL with no login. On a host with a public address that is an open database. Nothing outside the host needs 9000, 9003, 8812 or 9009 in this layout, so only Grafana and Prometheus get rules.
sudo ufw allow OpenSSH
sudo ufw allow from 10.0.0.0/8 to any port 3000 proto tcp
sudo ufw allow from 10.0.0.0/8 to any port 9090 proto tcp
sudo ufw show added
ufw was inactive on the Ubuntu image, so show added lists the queued rules:
Added user rules (see 'ufw status' for running firewall):
ufw allow OpenSSH
ufw allow from 10.0.0.0/8 to any port 3000 proto tcp
ufw allow from 10.0.0.0/8 to any port 9090 proto tcp
Turn the firewall on with sudo ufw enable only after the OpenSSH rule is in, or you’ll cut your own session. Swap 10.0.0.0/8 for your admin subnet. If writers live on other machines, add a rule for 9000 (and 9009 for ILP over TCP) from their subnet only, since 9000 also serves the web console and the SQL REST API. The rest of the hardening list we’d apply before trusting this with real data:
- Change the default
admin/questPostgreSQL credentials - Put Grafana behind HTTPS
- Route the six rules to Alertmanager
- Size Prometheus retention to your disk
The Prometheus overhead is small: 135 MiB of RSS and a 31 ms scrape every 15 seconds against a database pushing 100k rows a second. If you’d rather not keep a full Prometheus around, VictoriaMetrics on Ubuntu can scrape the same 9003 endpoint and serve Grafana through its Prometheus-compatible API. Either way, the one setting that decides whether any of this works is metrics.enabled=true. Turn it on the day you install QuestDB, not the day it falls over.