How to Create Data Visualizations On Python With One Click
Learn how and why you should use the Lux library for your next Data Science project
PYTHON
How to Create Data Visualizations In Python With One Click

You just started your new Data Science project. You took a quick look at the dataset, and now it's time for some exploratory data analysis. You need to create a few visualizations and figure out what you are trying to find out. You probably start writing the code using Matplotlib and Seaborn, two great libraries but very time-consuming. What if I tell you that you can skip these steps and create visualizations with literally one line of code? That's what Lux aims for.
Are you not convinced? Let me give you a demonstration, and then we can dive in and learn more about it. Here I will create visualizations for a worldwide vaccination progress dataset:
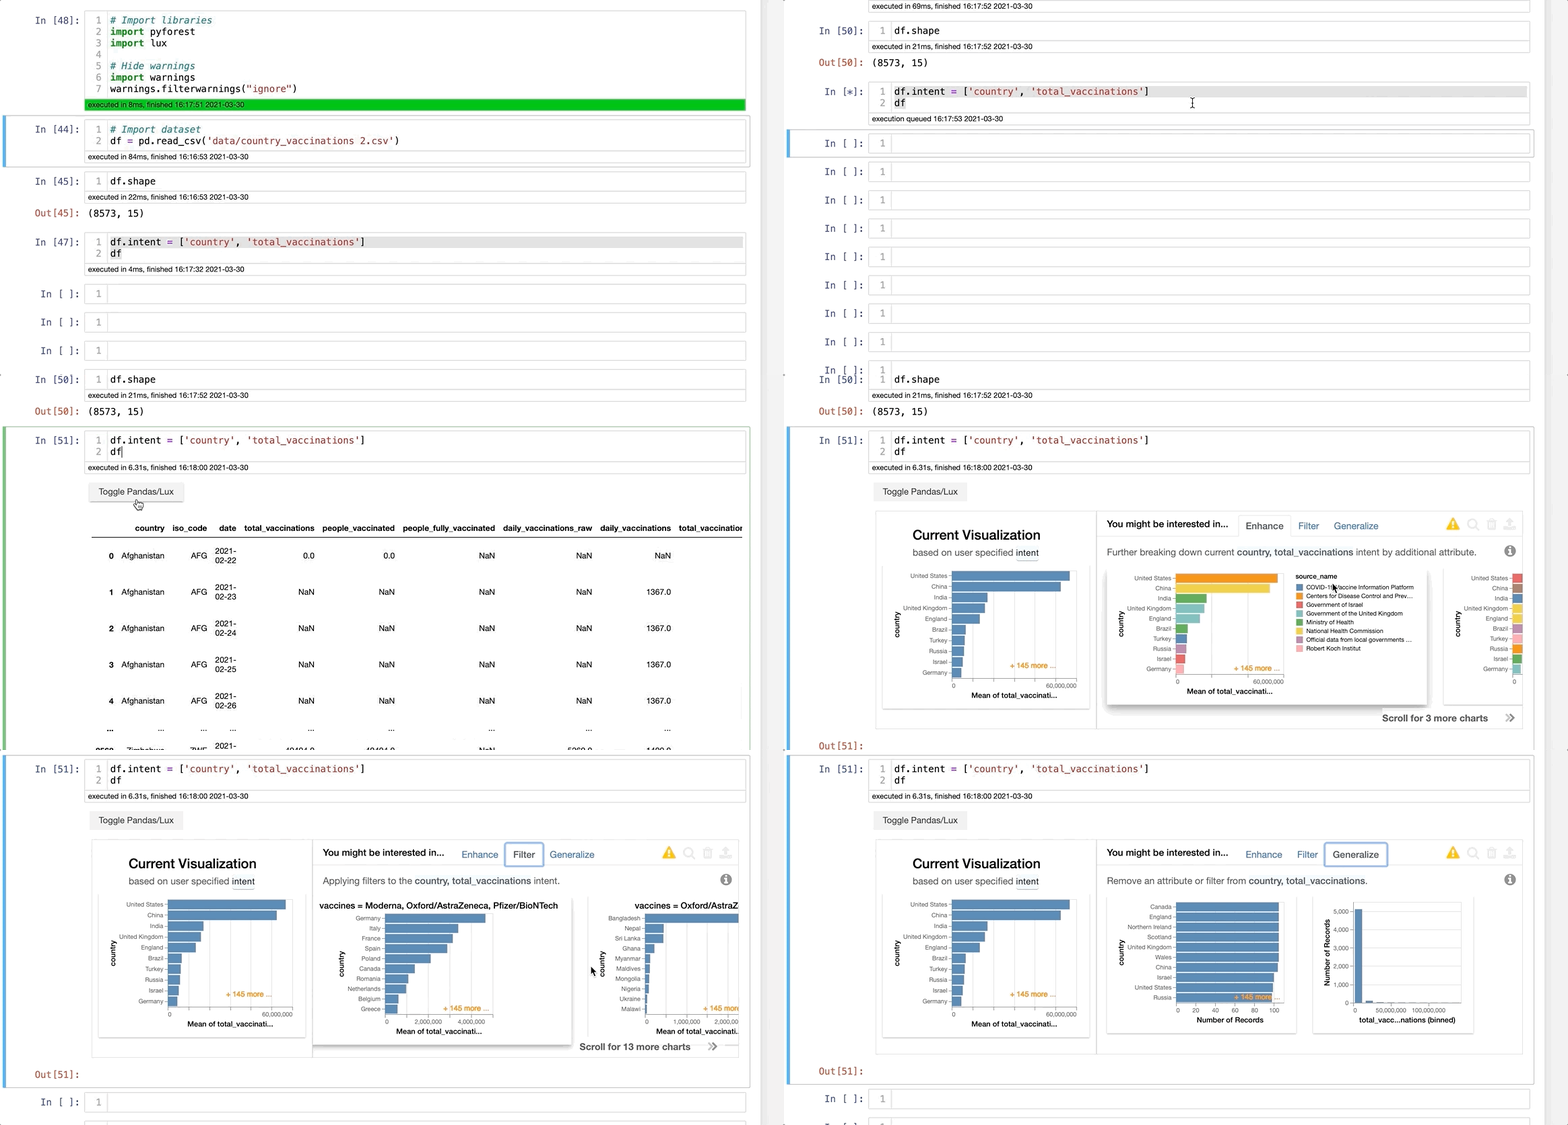
Convinced? Then let's talk about it. Lux is a brilliant Python API that makes data science projects easier by automating data visualizations. It can be handy for those projects that you have no idea what you are looking for. Even when you know what you are looking for, Lux can help you get insights about your features so that you can focus on using your brain for more complex problems. By the end of this article, you will be able to use Lux for your next project. I created a repository on GitHub with the code I used for demonstration purposes. You can find it here:
Installation
Installing Lux is just as easy as using it. Just type pip install lux-api on your terminal, and you should be good to go. Now, you will need to activate the extension to Jupyter Notebook. You can type the following on Jupyter Notebook:
And you are all set. Now, let's learn how to use it. First, let's import pandas and lux to the notebook and deactivate those annoying warnings.
Using Lux to create visualizations
Now, let's import the dataset. You can find the dataset on Kaggle or in my repository on GitHub.
From now on, if you type df, you will see a new button under the cell. You can click on it and start seeing your first data visualizations:
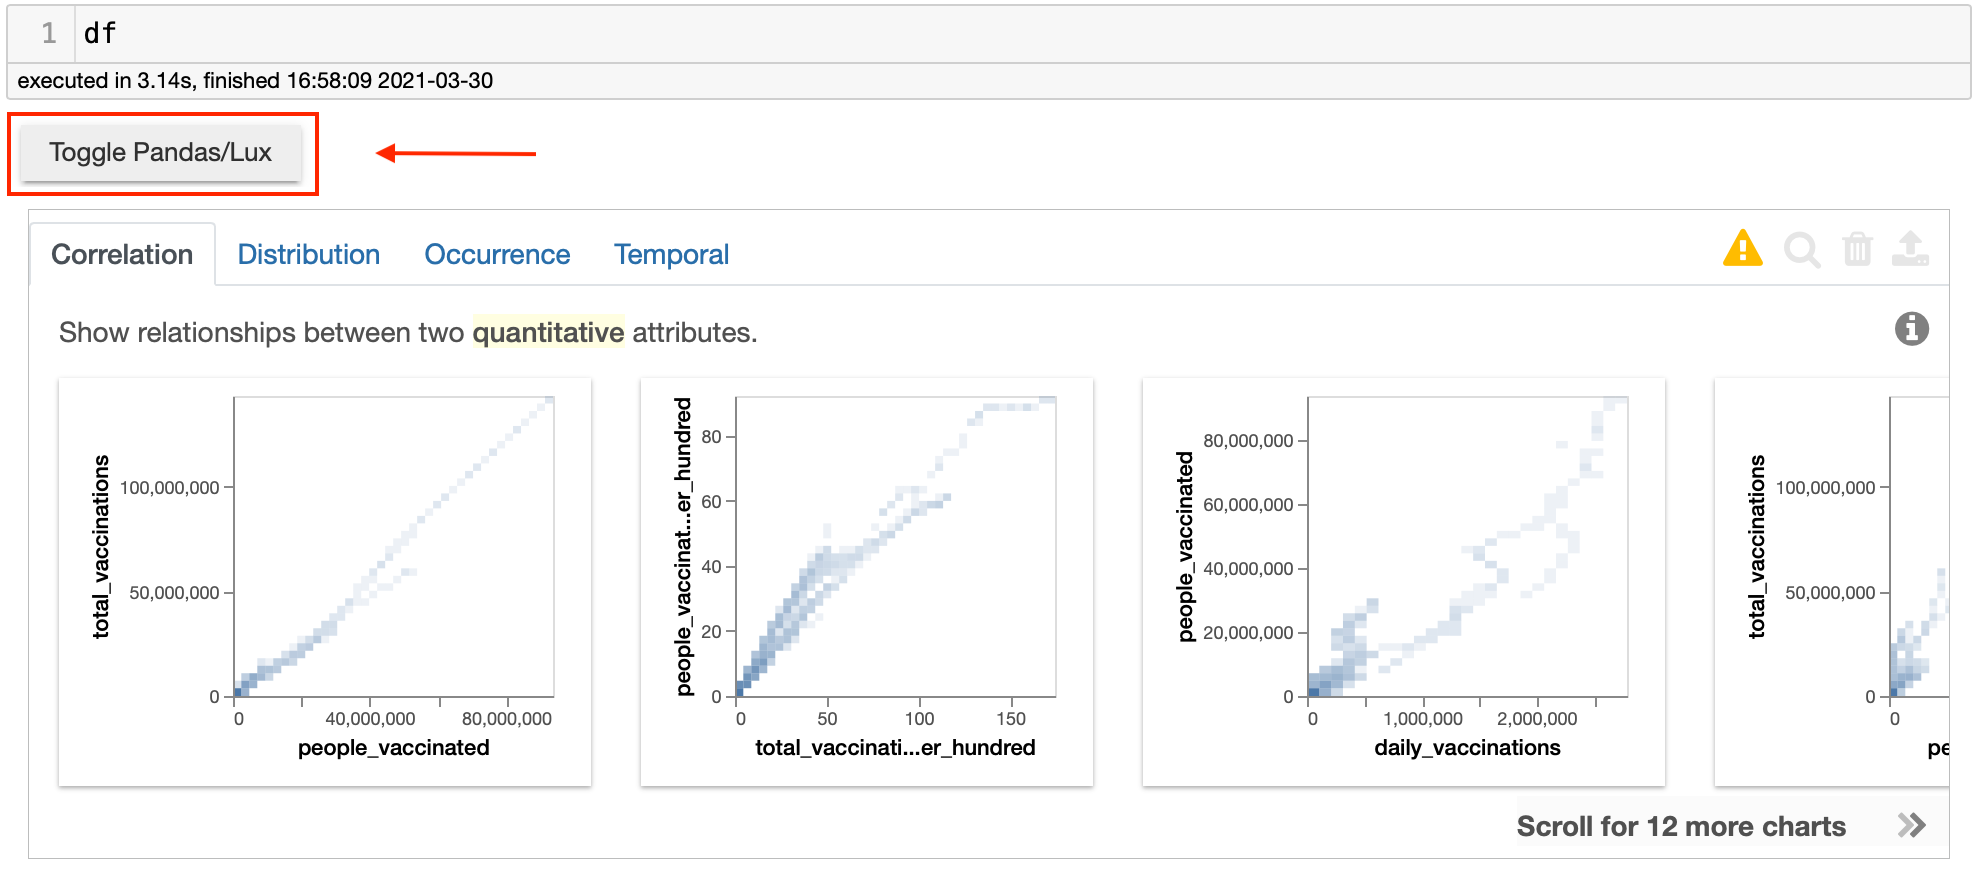
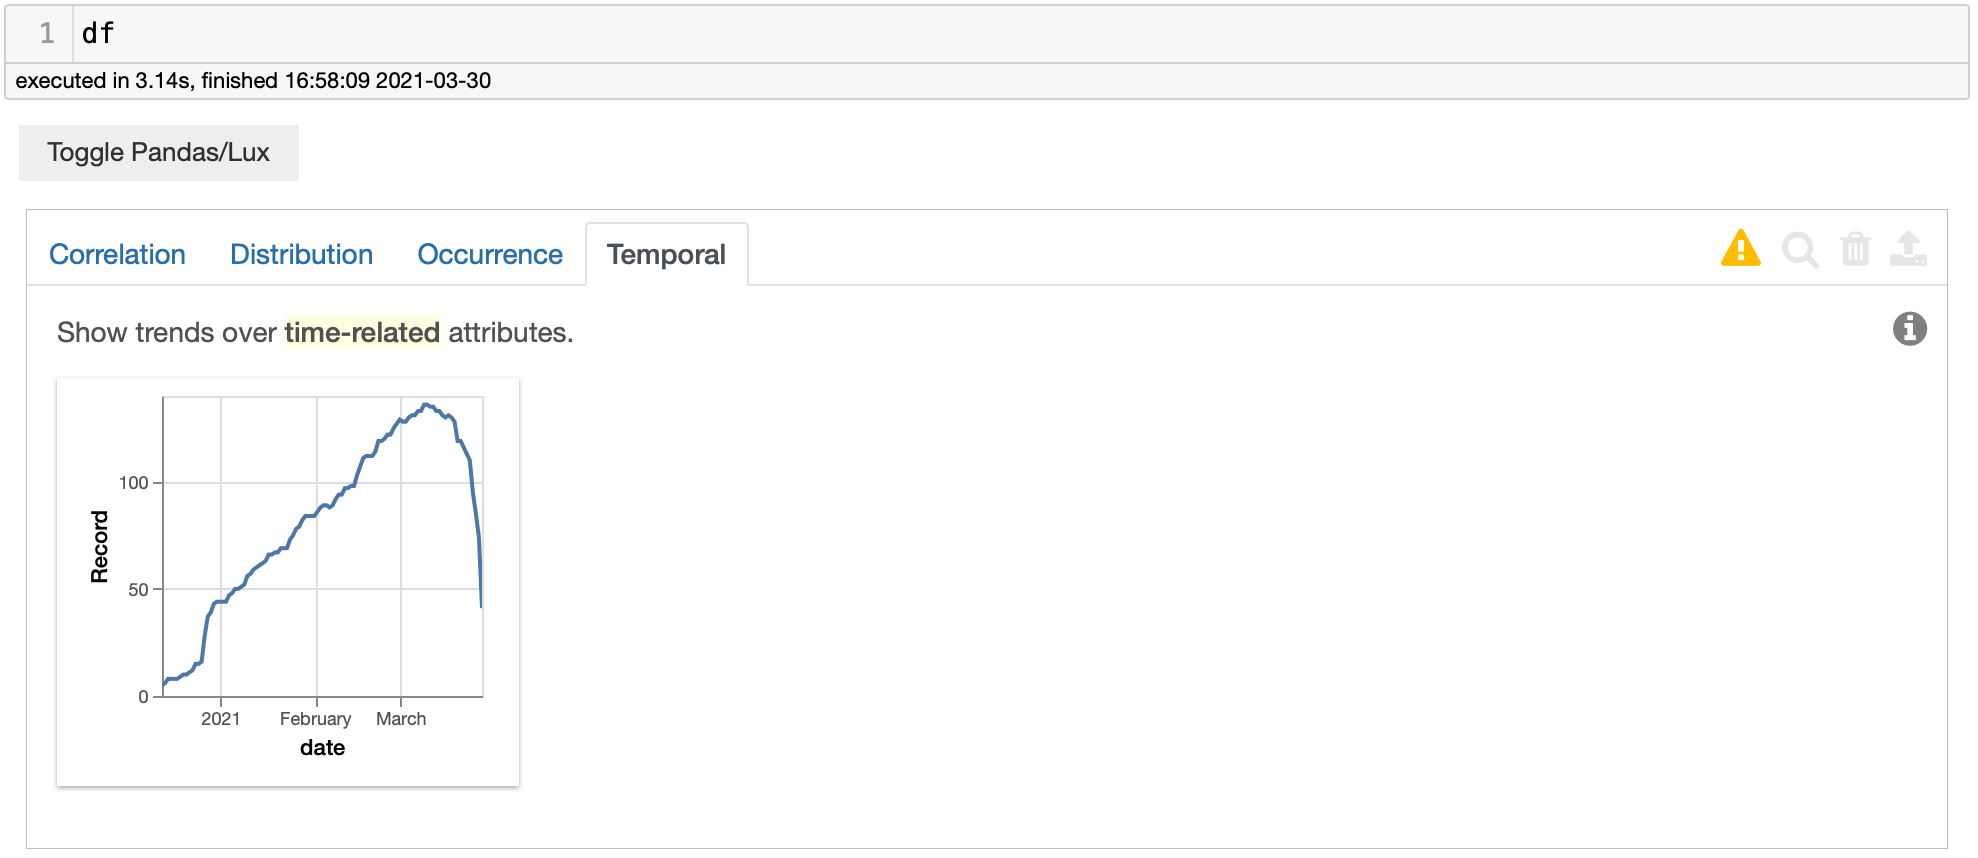
Quite easy. You can see some visualizations here. They are organized in some categories, depending on your dataset. In this case, we can see the correlation, distribution, occurrence, and temporal. Below, you can see that I clicked on Temporal data, and we can see a time series visualization.
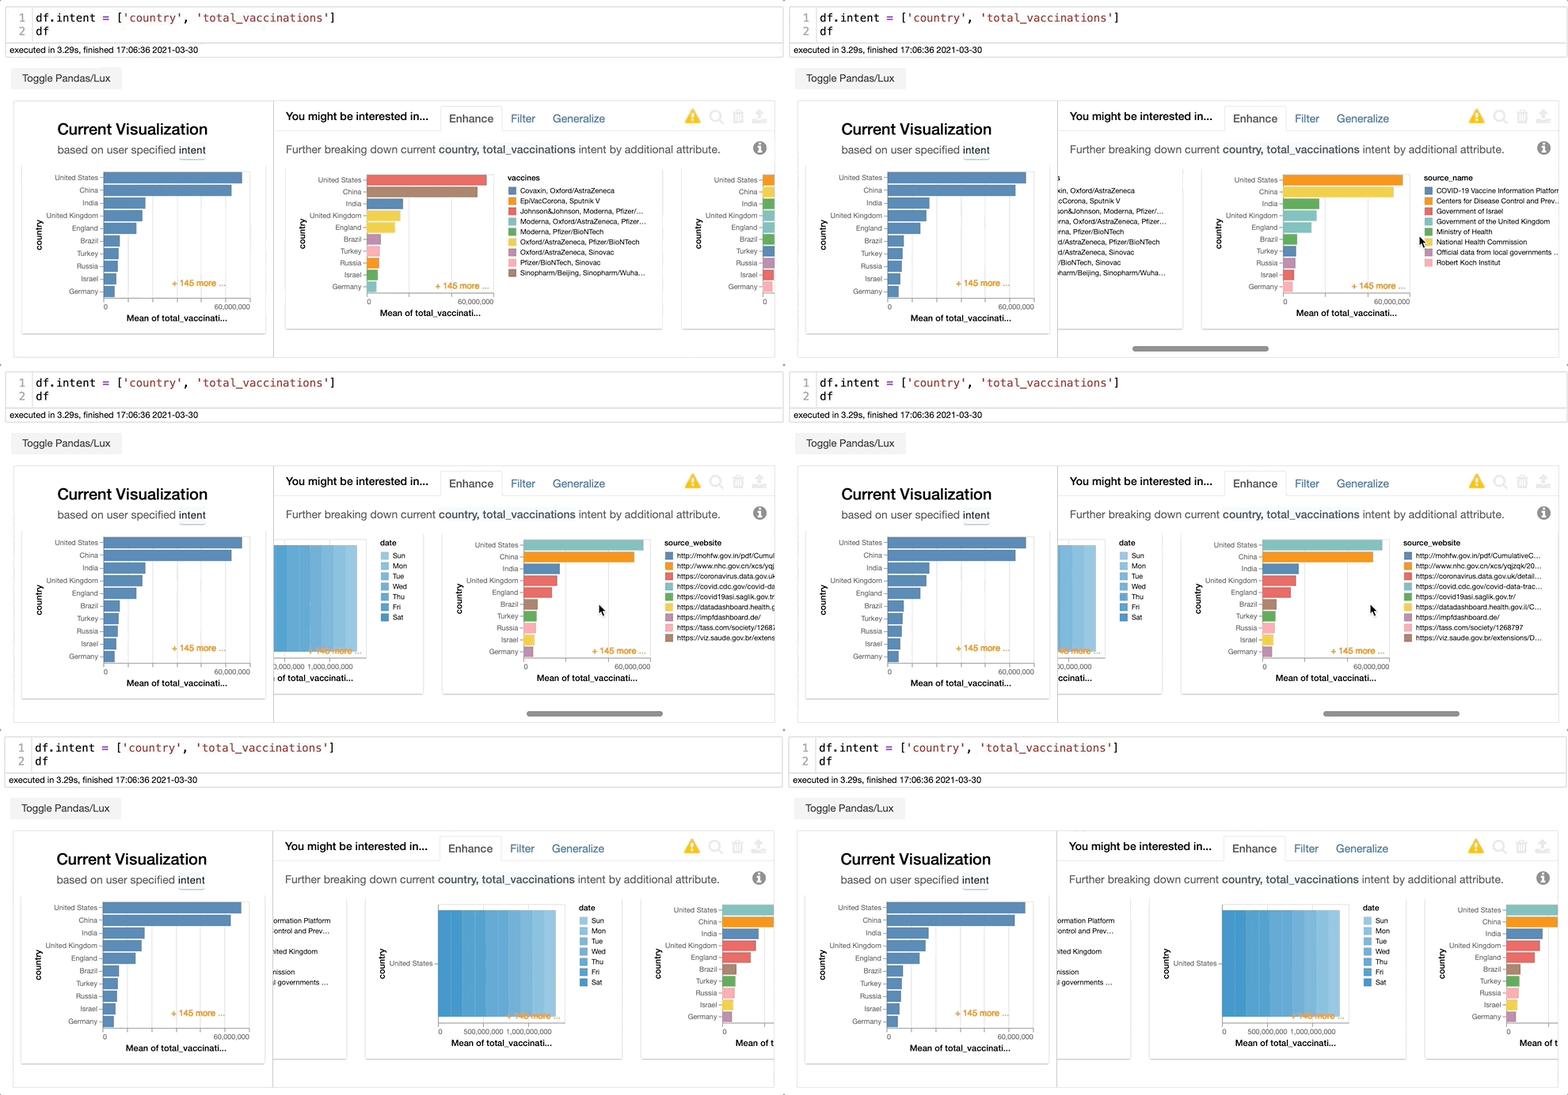
You can also compare features using df.intent = ['column_1', 'column_2']. Here is where Lux starts to show it's potential. Let's explore this option a bit more:
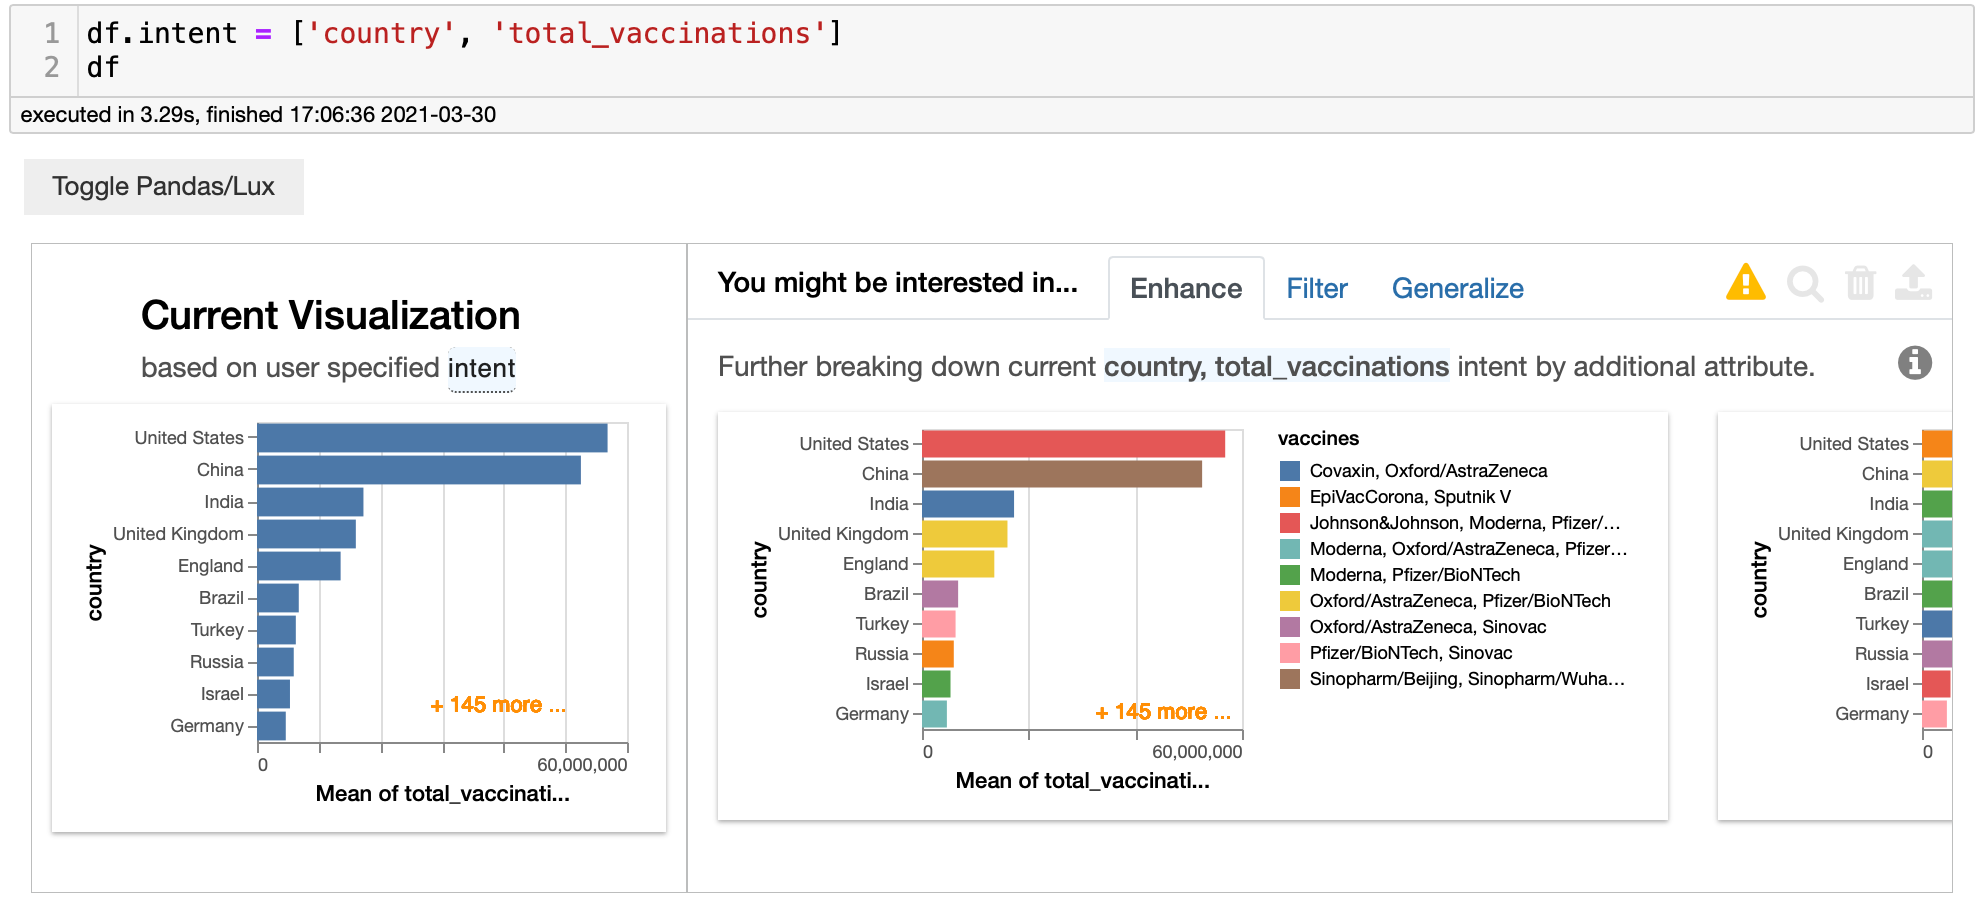
In this case, I'm comparing the columns country and total_vaccinations. Lux edit the columns and creates new features depending on the dataset we have. For example, we can see below that Lux created a visualization showing the vaccination volume for each day of the week.
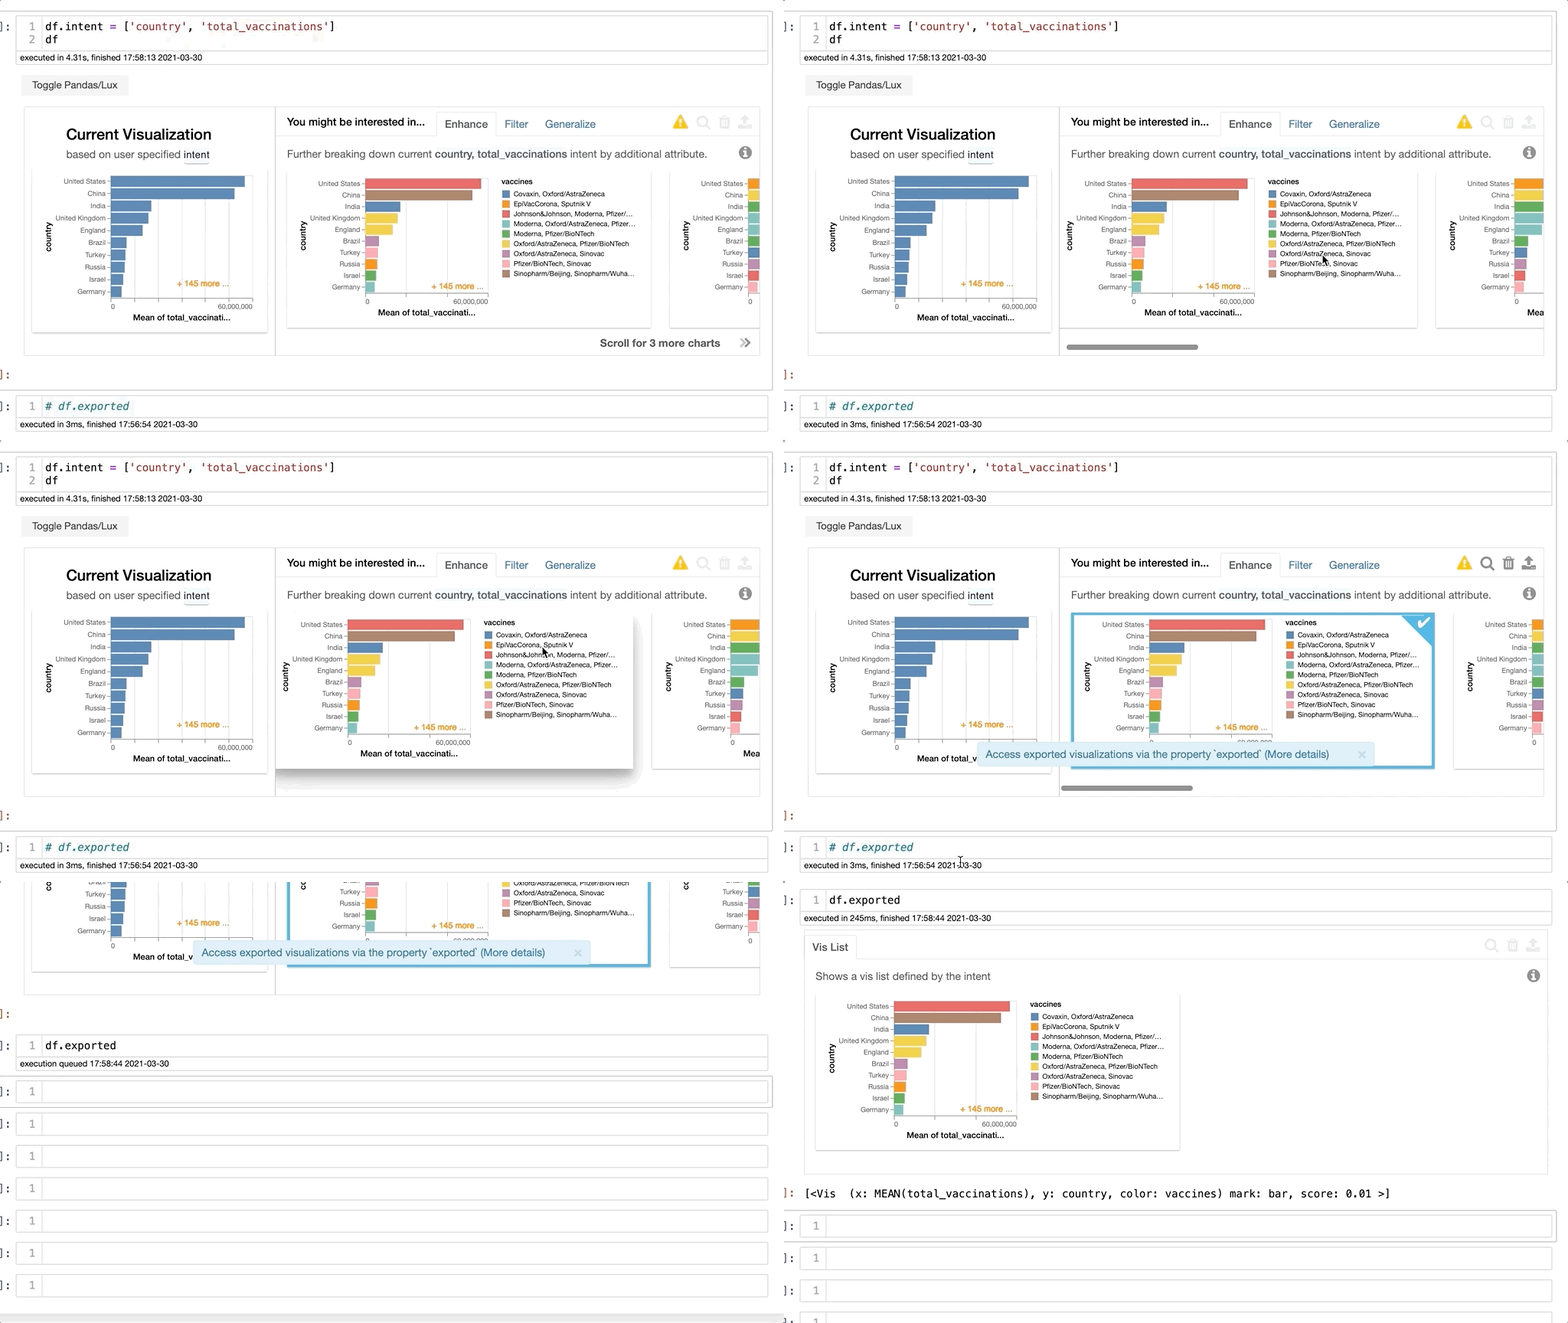
Fantastic, you just found a visualization that you are interested in exploring more. You can click on the image and export the image into a variable called exported. You can see an example below. You can see that Lux includes what was used for the X and Y variables.
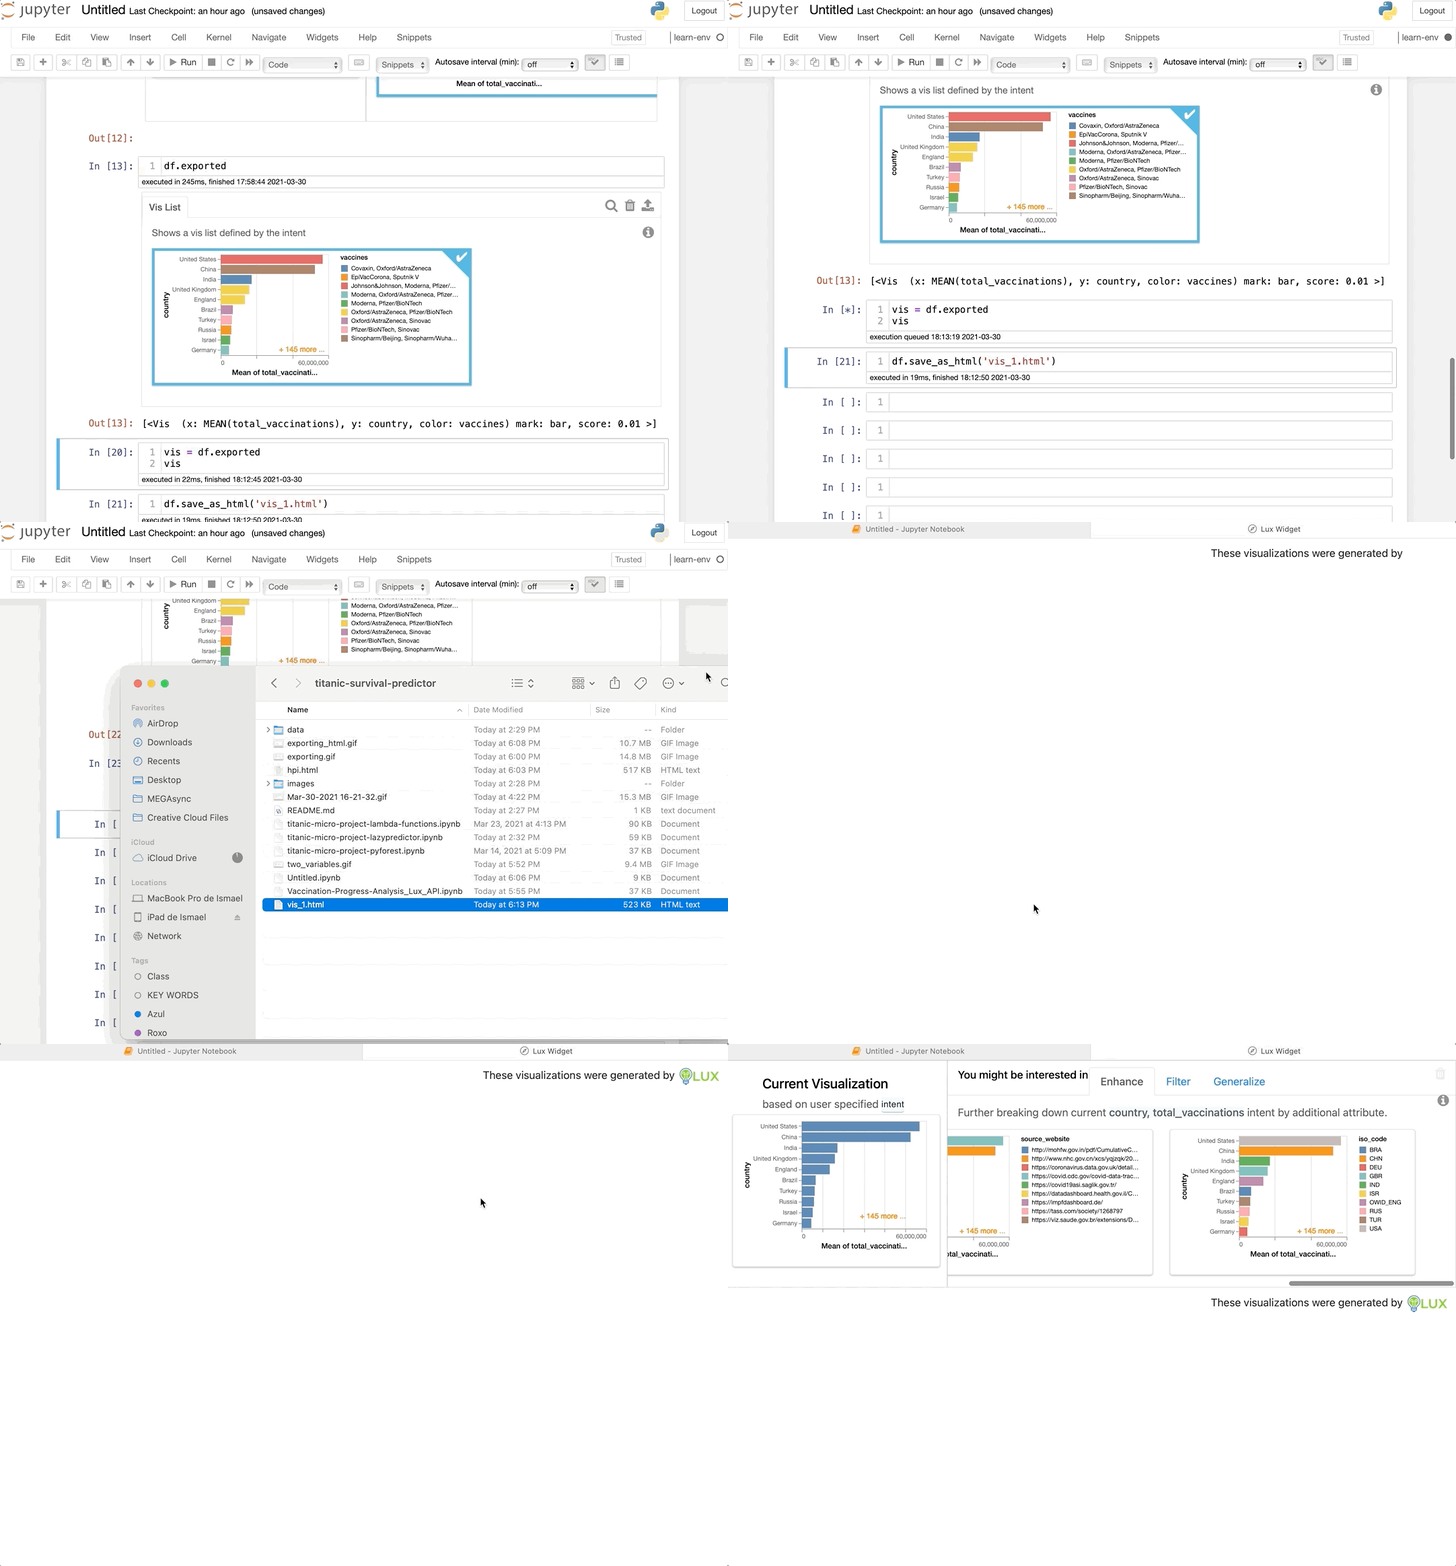
You can save the visualization into another variable and access it whenever you need it. Lux's other very cool thing is that you can export the files into an HTML file and share with other people without having to share datasets or Jupyter Notebooks. How cool is that?
You can also use df.recommendation['Enhance'] to understand which variables Lux is using for each variable. You can create visualizations using Matplotlib and Seaborn with this information. The other cool thing is that you can slice the visualizations and focus on your favorite ones just like you would do with Python lists.
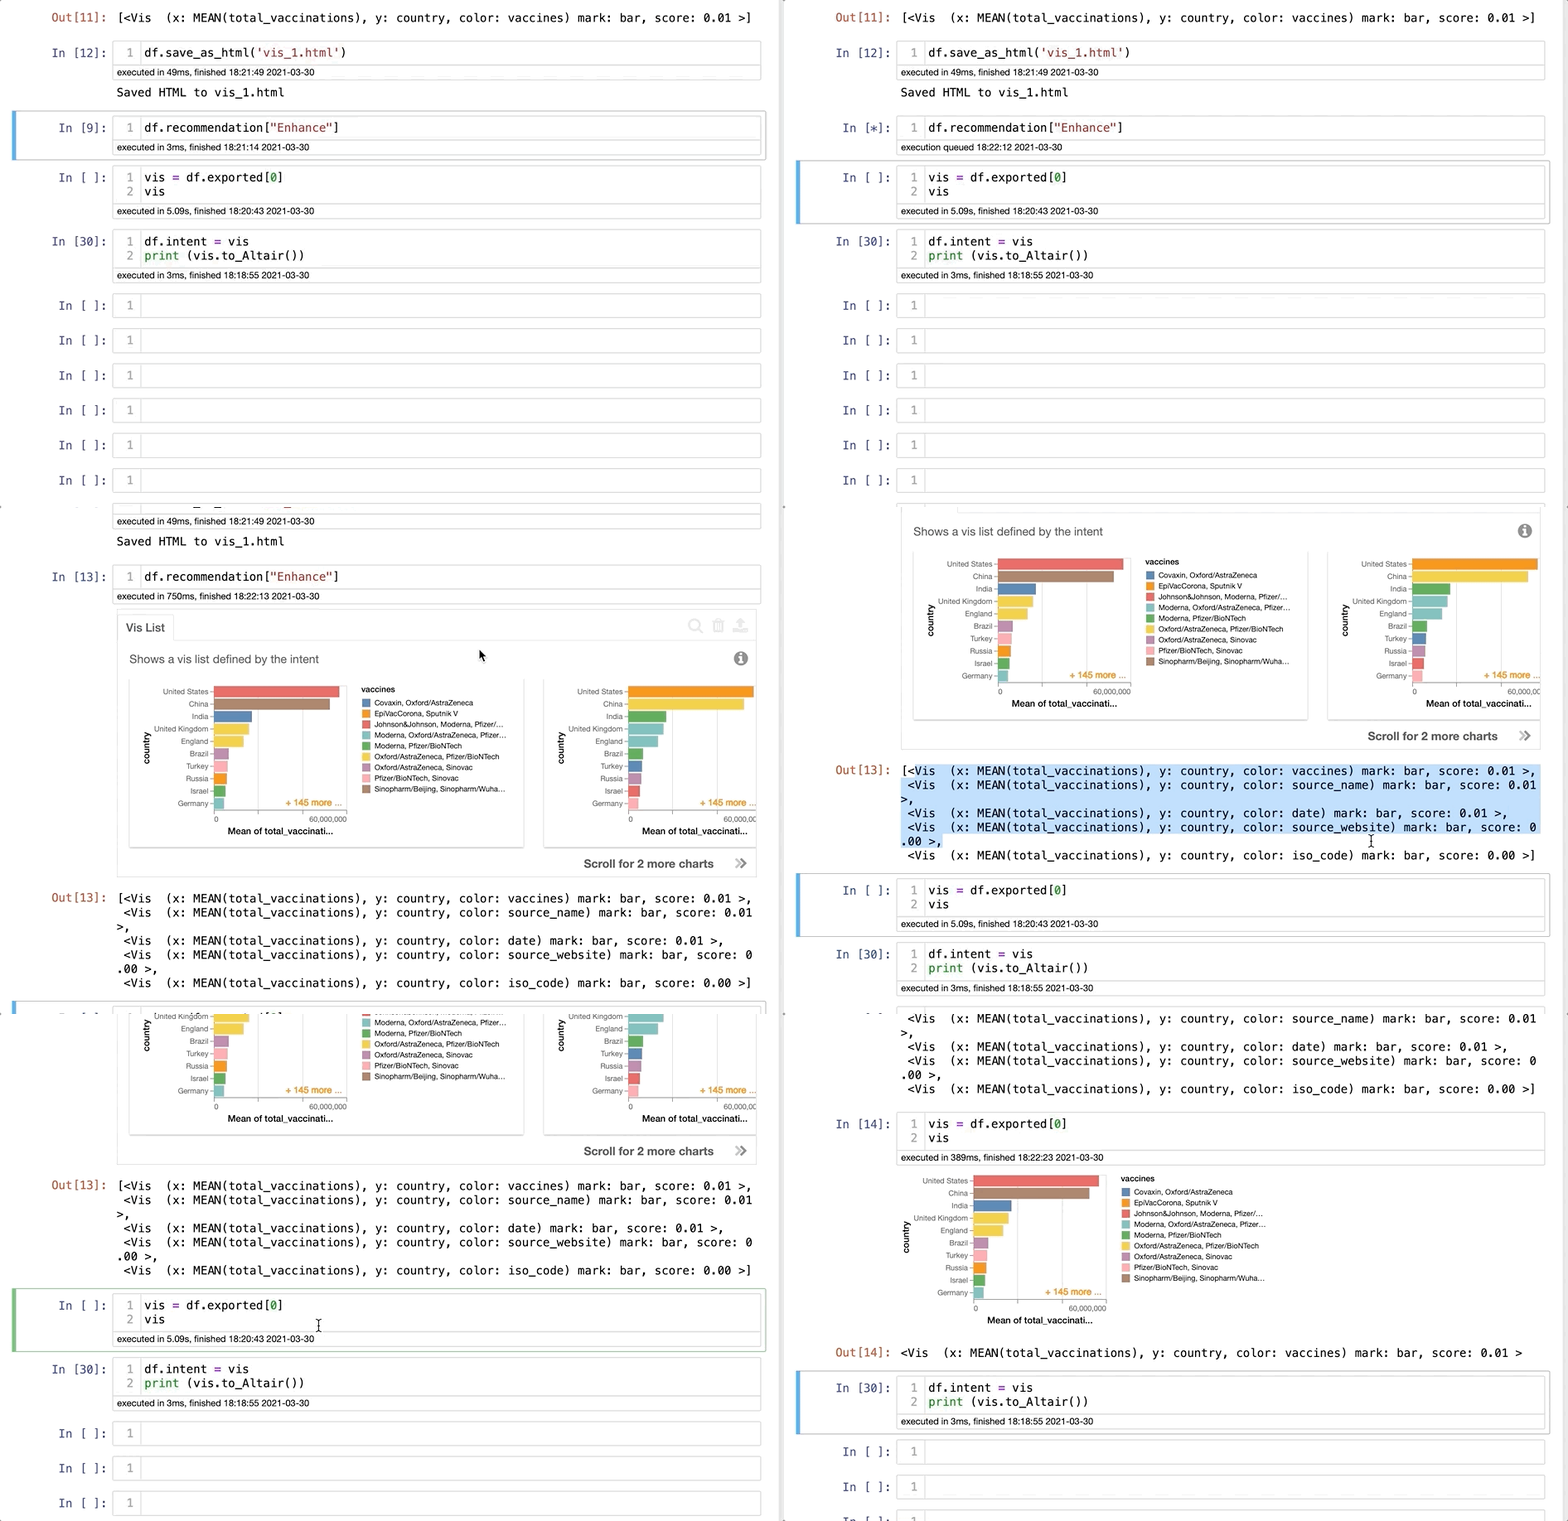
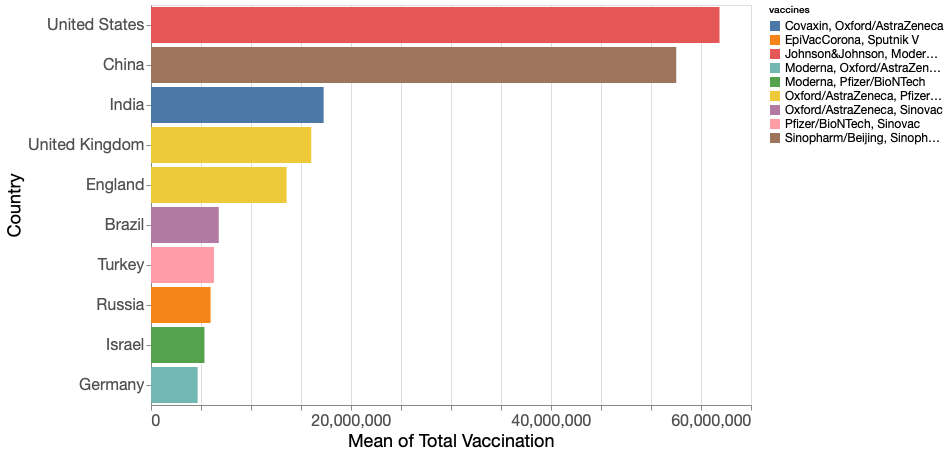
That's all nice, but what if you want to edit one of these visualizations for a presentation or report, for example? That's also very easy. We need to add the visualization variable to df.intent and type print(vis.to_Altair()), and copy and paste the code to another cell. You can now make your own edits. Keep in mind that Lux uses the Altair library. Once you have the code, it's pretty straightforward. I learned how to make some basic edits using Shift + Tab to find where I could edit the fields. You can then export the visualization in PNG, JPG, or even see the JSON code.
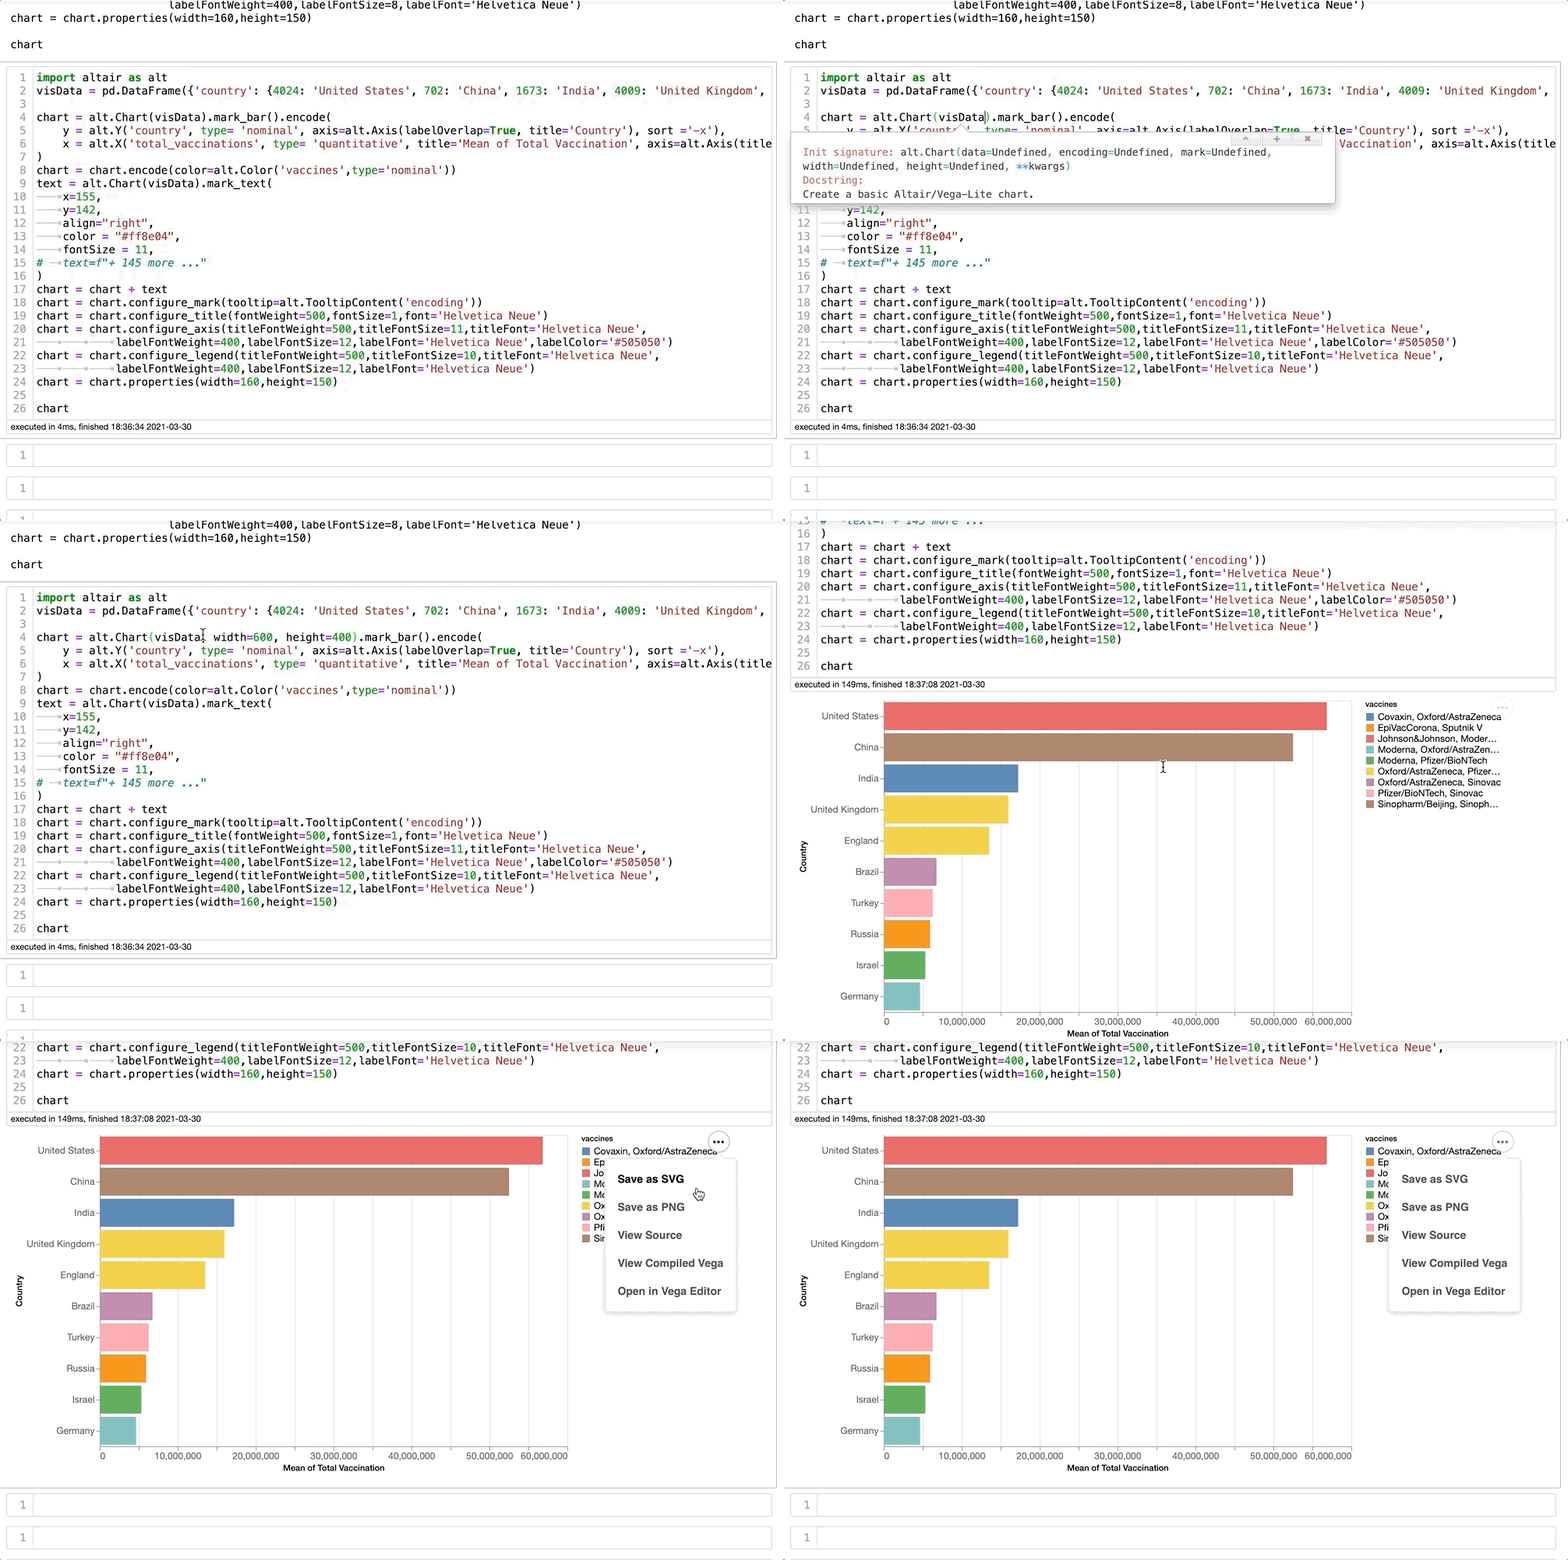
And here is the final result:
Conclusions
Lux is an easy-to-use API that can save you some time at the beginning of your projects. It can give you insights into the dataset and decide what decisions you should make about your project. Matplotlib and Seaborn are still reliable tools, and I don't think Lux will be capable of substituting them any time soon. However, you can add Lux to your EDA processes and make sure that you consider every critical aspect of your dataset. You can also check their documentation here for more information.
Thanks for reading, and let me know if you have any questions.