How to easily join data by location in Python - Spatial join
How to do spatial join easily in Python and Why it is a powerful tool often ignored in data science.
How to quickly join data by location in Python - Spatial join
The chances are high that you have joined two tables if you have used Pandas Library. It is incredible how easy it is to combine two different datasets that share columns. But do you know that there is an easy way to join tables (DataFrames) based on locations?
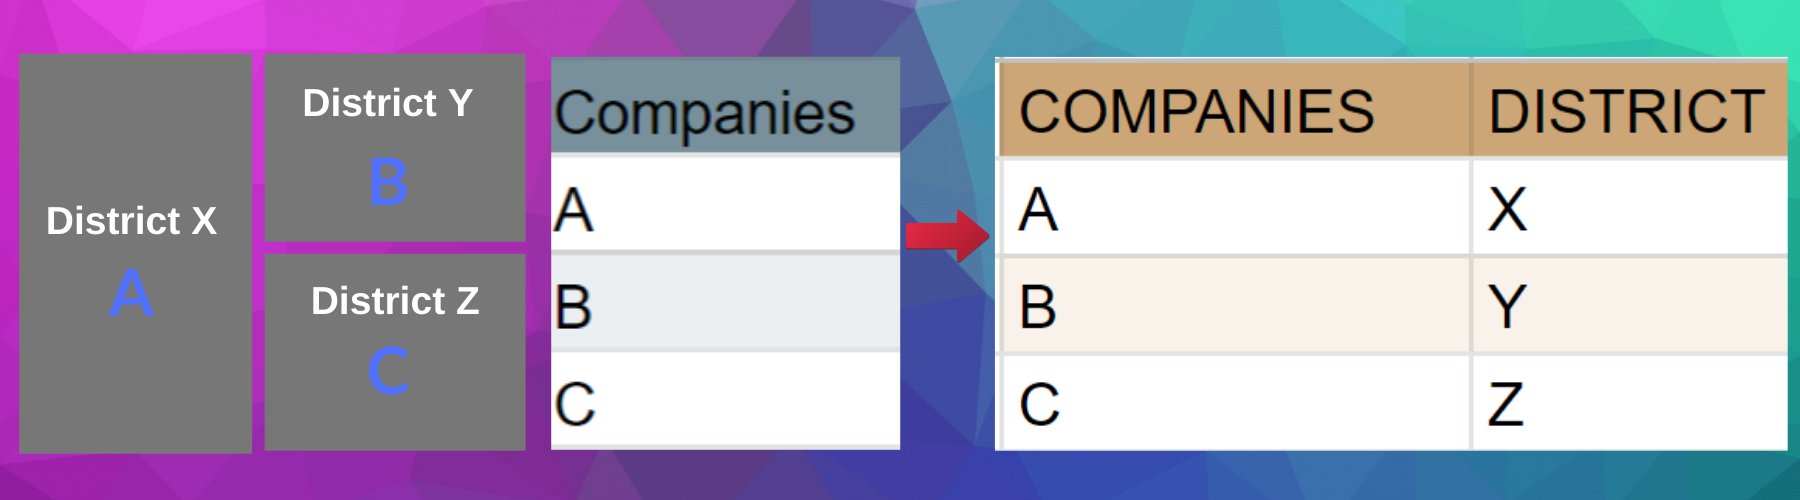
I show you an efficient way to join your tables using Spatial join. Spatial join is similar to joining data by attributes. The key difference is only that the tables are joined based on their locations in the spatial join. It is necessary to have matching keys in both tables to perform join by attributes; in contrast, you need locations (Latitude & Longitude) to perform the spatial join.
Use cases for spatial join are many. Let us say you have schools as points and districts as areas (Polygon) and you want to determine how many schools are in each district. By performing a spatial join, you can quickly transfer the point table into areas table or vice-versa.
Practical Application: An Example with Airbnb Dataset
Enough for the concept and hypothetical example. Let us take a concrete example. I want to get the count of how many Airbnb listings are in each voting district. I use Airbnb Dataset for Stockholm in this tutorial. The highlighted datasets are used to demonstrate the spatial join.
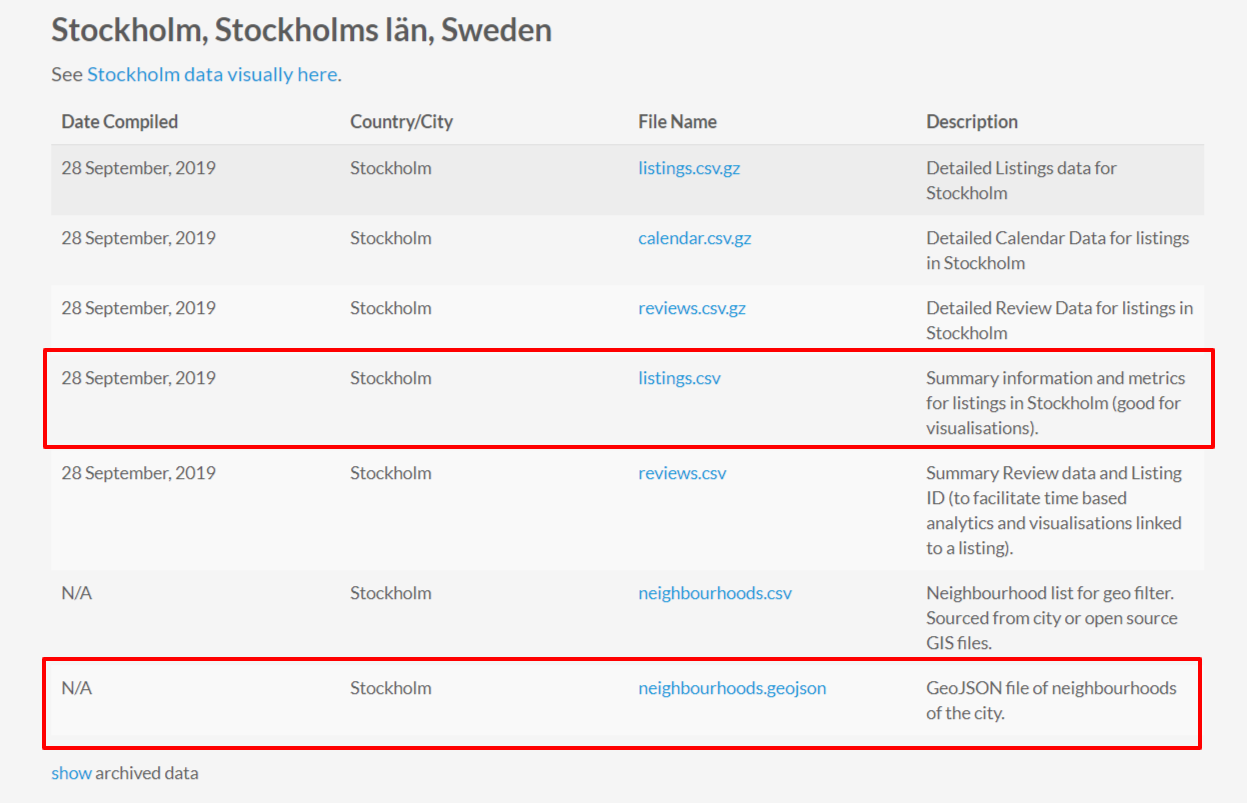
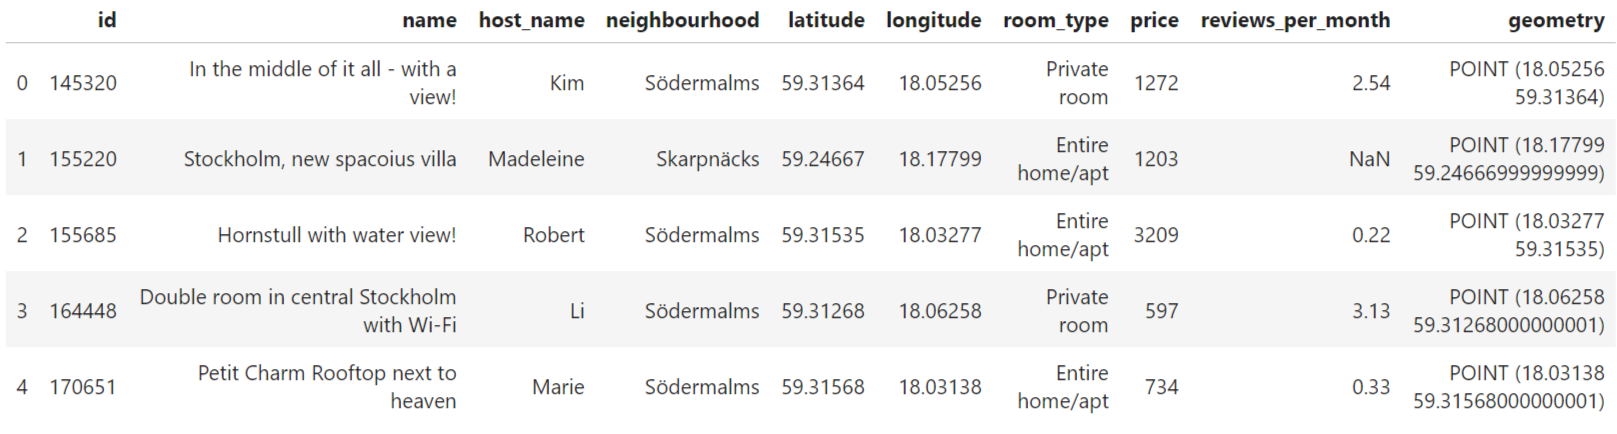
Let us read first the tables in pandas as usual with .read_csv(). In step 2, We convert the latitude and longitude into Geometry using Geopandas. The neighbourhoods data is in Geojson, so we can directly read in Geopandas. Geopandas is a high-level pandas library that makes it easy to work with location data.
The gdf_listings table has different columns for each property, including hostname, neighbourhood, latitude and longitude. And Geopandas conversion adds the geometry column which allows us to do the spatial join.
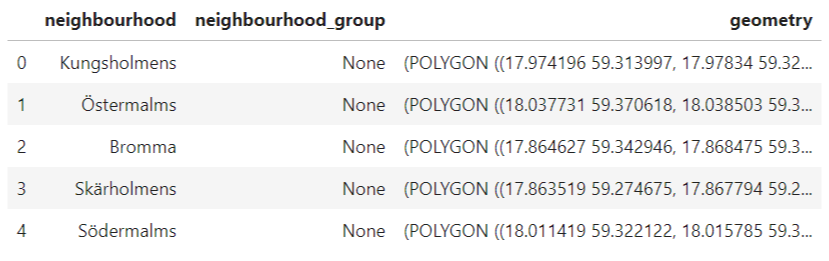
On the other hand, the Geojson neighbourhood file holds the neighbourhoods name and Geometry.
Both datasets have neighbourhood column, and if you plot them overlayed, they perfectly align well (Map below), and we can easily Groupby and take the size of each neighbourhood to count the number of listings in each neighbourhood.
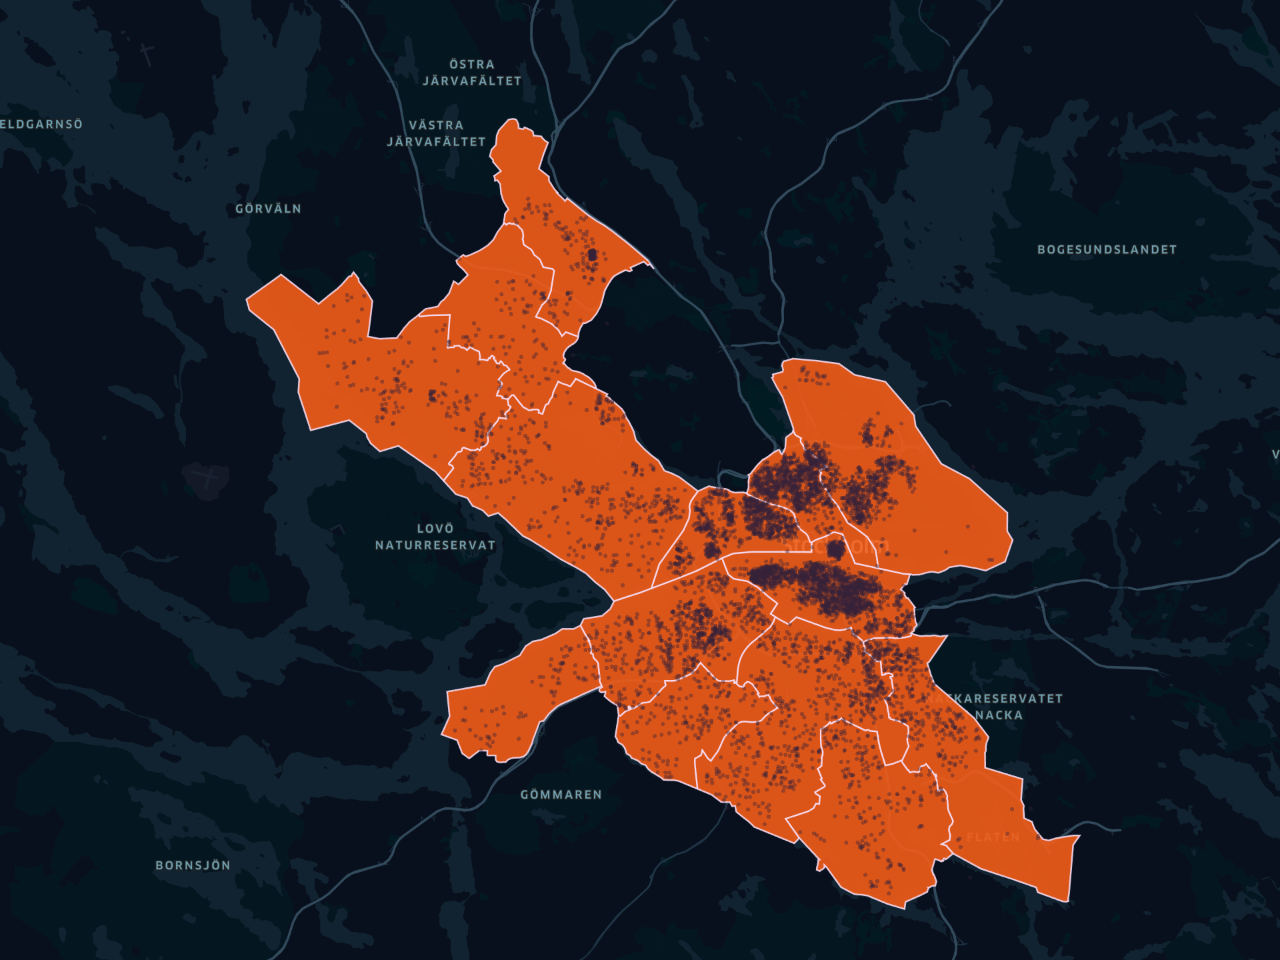
But, imagine you have a different set of neighbourhoods (Polygons). Let us say the voting districts (smaller areas) which offer a better granularity and have other interesting attributes like population totals. Let me read the data first with Geopandas.
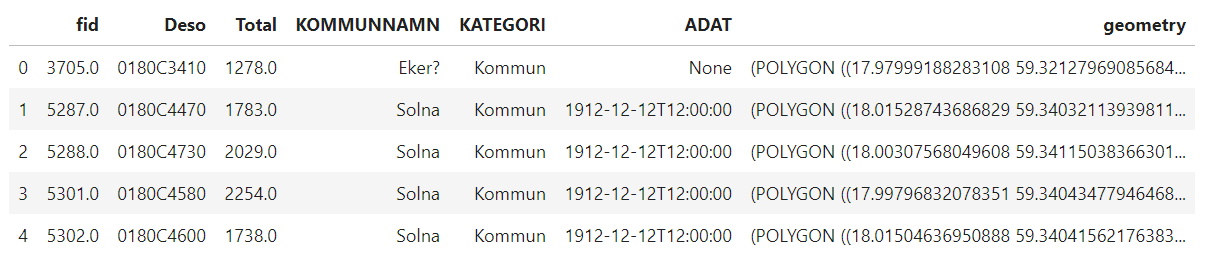
Each voting district has aDesocolumn which holds the code for the district and Totalwhich has a total population in each district. These new granular (smaller) areas also perfectly overlay with the points dataset, but the problem is that we don't have which voting district the point belongs. The data only came with neighbourhoods column
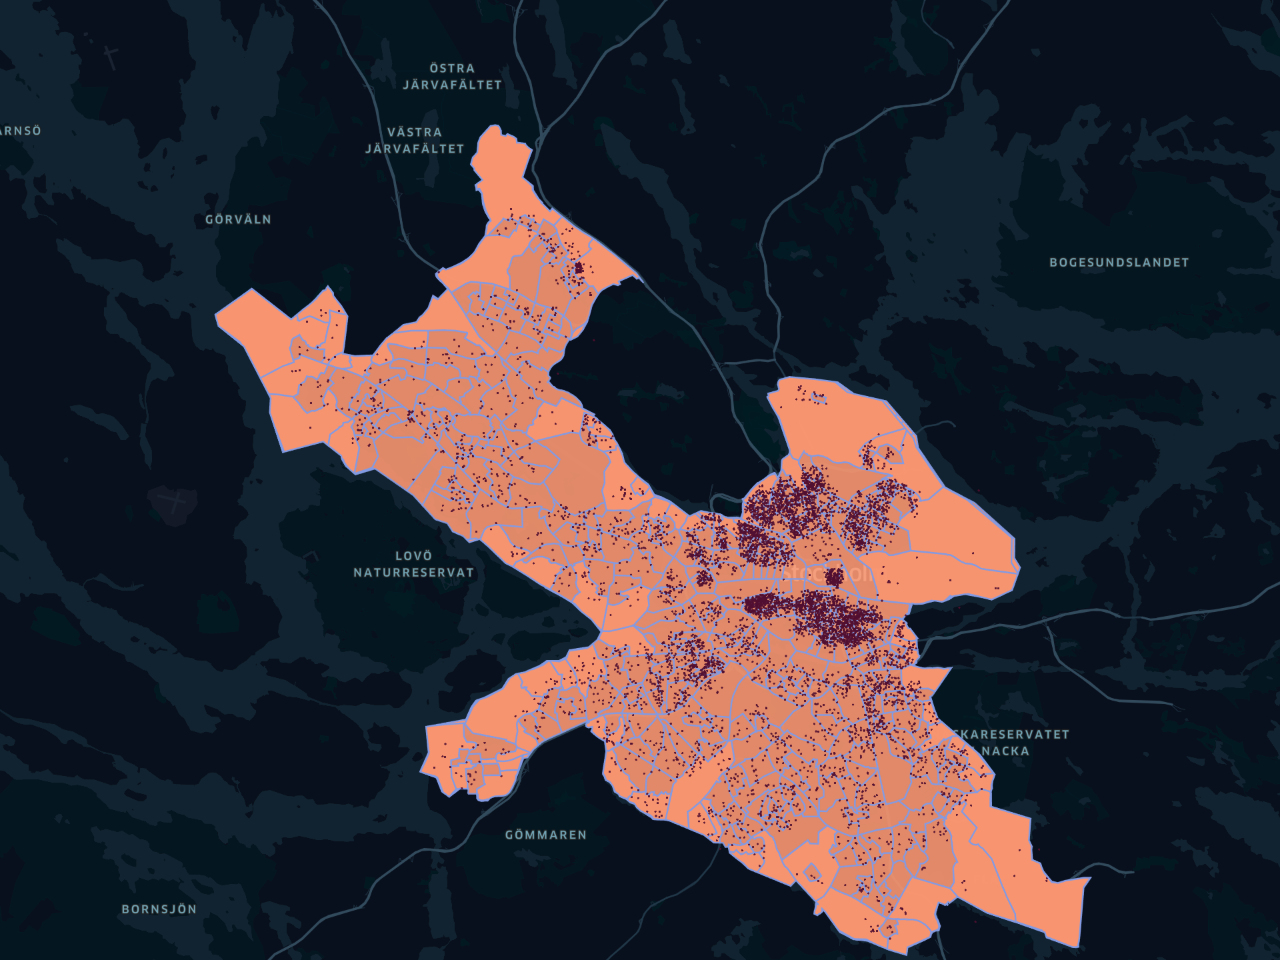
Spatial Join
Let us say we are interested in counting the number of listings per the voting area (voting districts). Although it is not readily available in our columns, we can do this easily and this where spatial join comes handy. With one line of code, you can determine which point is within each voting district.
The above code joins gdf_listings to stockholm_areasbased on their locations. The op parameter determines what kind of join you want. In this case, we provided "within" - that determines which area the point belongs. Here is a sample of 5 rows from the joined table.
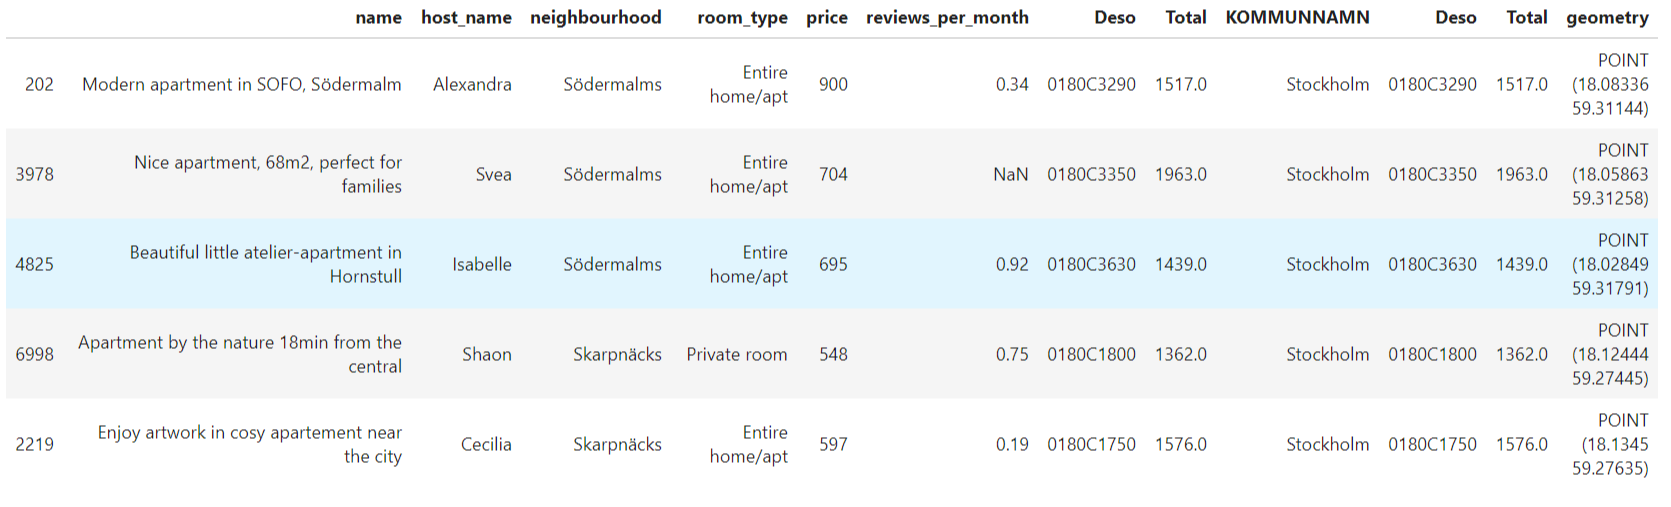
As you can see, this table joins the two based on their locations. We have the attributes of the point as well as which area the point belongs. Now it is easy to count how many listings are in each area with pandas group-by function. We can perform pandas Groupby like this, to get how many listings are in each voting district area.
We end up with a DataFrame of district area code Deso and listing counts in each area.
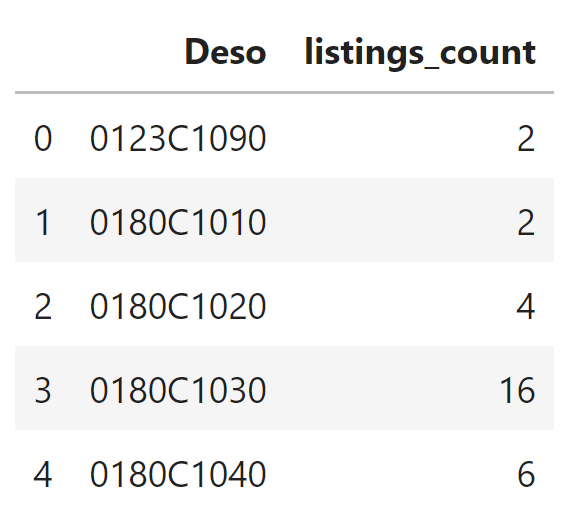
Notice that this grouped data is a Dataframe. If you want to have it with Voting areas dataset, you can simply use pandas merge function based on "Deso" column on both Dataframes.
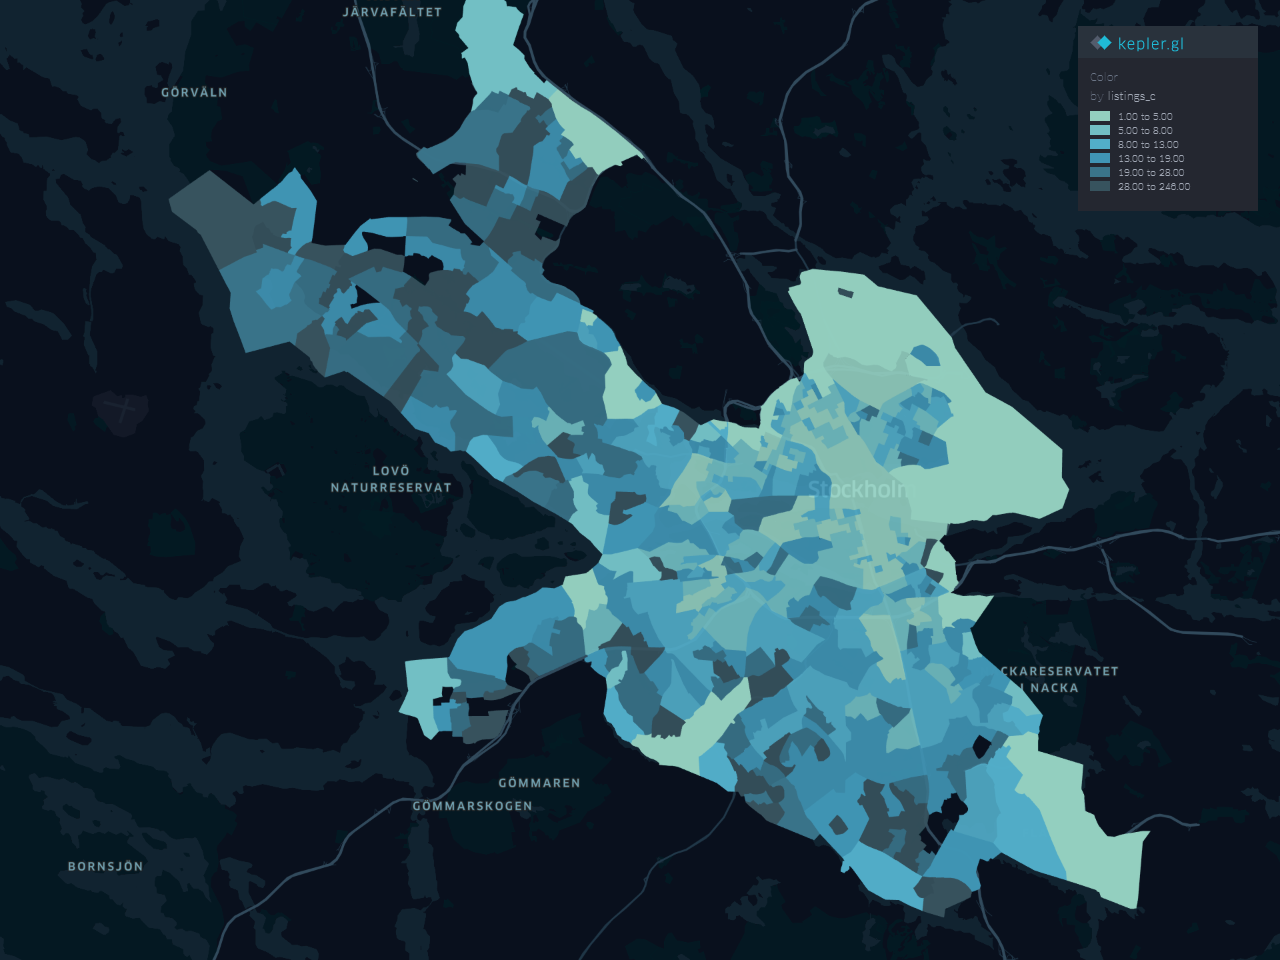
The result of the merge is GeoDataFrame which you can plot geographically. The following is Choroplpleth map for the number of listings in each voting district.
Give spatial join a try if you have some ideas otherwise try joining Airbnb dataset of a city of your choice and with different areas.
Conclusion
Spatial joins are a powerful tool not often used in data science. It is quite intuitive and straightforward to do in Python with the help of Geopandas. In this tutorial, we have performed a spatial join with a practical example using Airbnb dataset. I hope you find this useful to add it to your data science skills.
The code for this tutorial is available in this GitHub repository.
A google colab notebook is also included in the github repository if you want to run the code for this article directly.