Save Hours of Work Doing a Complete EDA With a Few Lines of Code
PYTHON
With This Library
Learn how to do a use QuickDA for your next project and save hours of work

Whether you are a data analyst or data scientist, you have heard that professionals spend 80% of their time doing data cleaning and only 20% modeling. That is true that data cleaning and exploratory data analysis take multiple steps to be performed, and remember all the code requires a lot of practice. A simple data visualization, for example, requires at least three lines of code to be minimally presentable. However, what if I tell you that there is a way to reduce the time spent on EDA drastically? That's when QuickDA can be handy.

QuickDA is an easy-to-use, intuitive low-code library that allows you to perform data cleaning, data exploration, and data visualization with a few lines of code. In fact, we will be using only one line of code most of the time. I have created a little project to demonstrate how powerful QuickDa can be. You can find the notebook here.
Getting Started
The easiest way to install QuickDA is by types pip3 install quickda in your terminal and that's pretty much it. You can use git close by copying and pasting git clone [https://github.com/sid-the-coder/QuickDA.git](https://github.com/sid-the-coder/QuickDA.git) into your terminal. Now, let's explore this amazing library.
For this project, I will only use our old friend Pandas and QuickDA. NumPy, Matplotlib, Seaborn are not necessary. For QuickDA, I will use the following libraries:
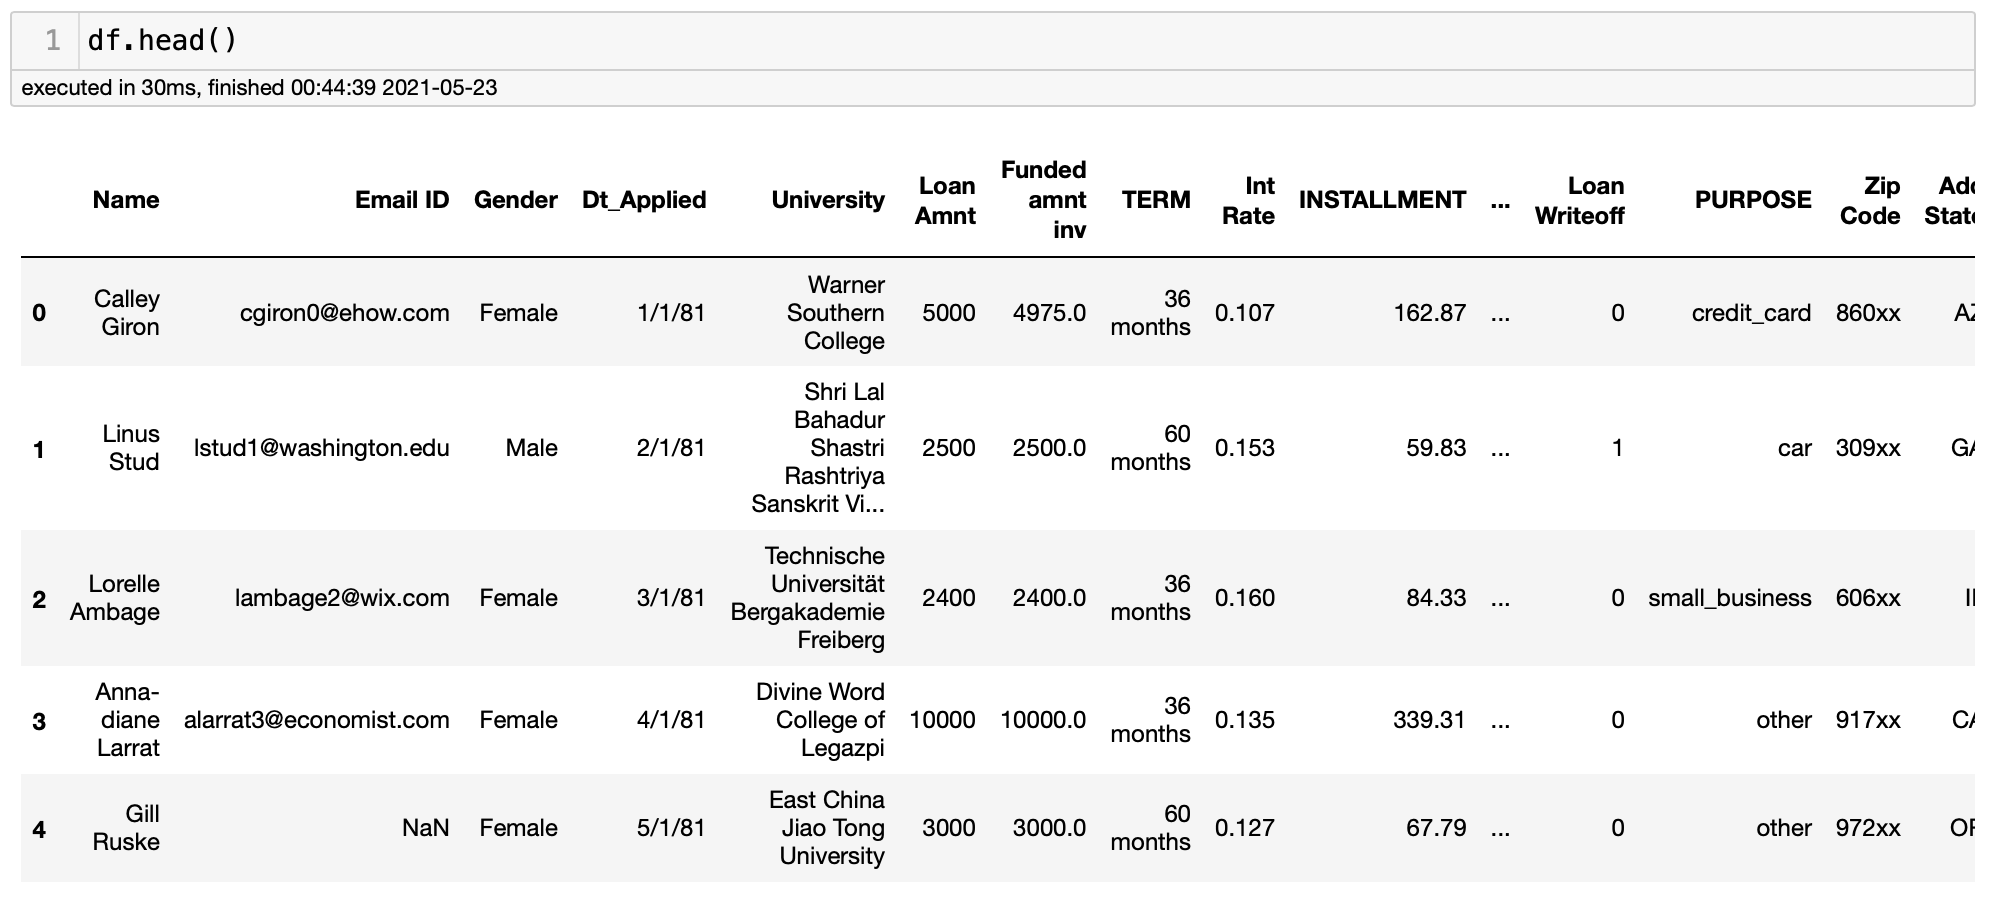
I will be using the loans.csv. You can find the dataset in my GitHub. I was not able to find the original source, so if you find it, please let me know so I can add the credits.
Summarize Dataset
Now we will start seeing all the power of QuickDA. First, we can summarize our dataset using the code explore(df) and get the data types, count, null values, number of unique values, and descriptive statistics, such as minimum, maximum, mean, and median. Note that QuickDA can summarize stats for the categorical data as well. This is not possible with the regular df.describe() function. Let's check it out and explore this function, because it can be powerful.
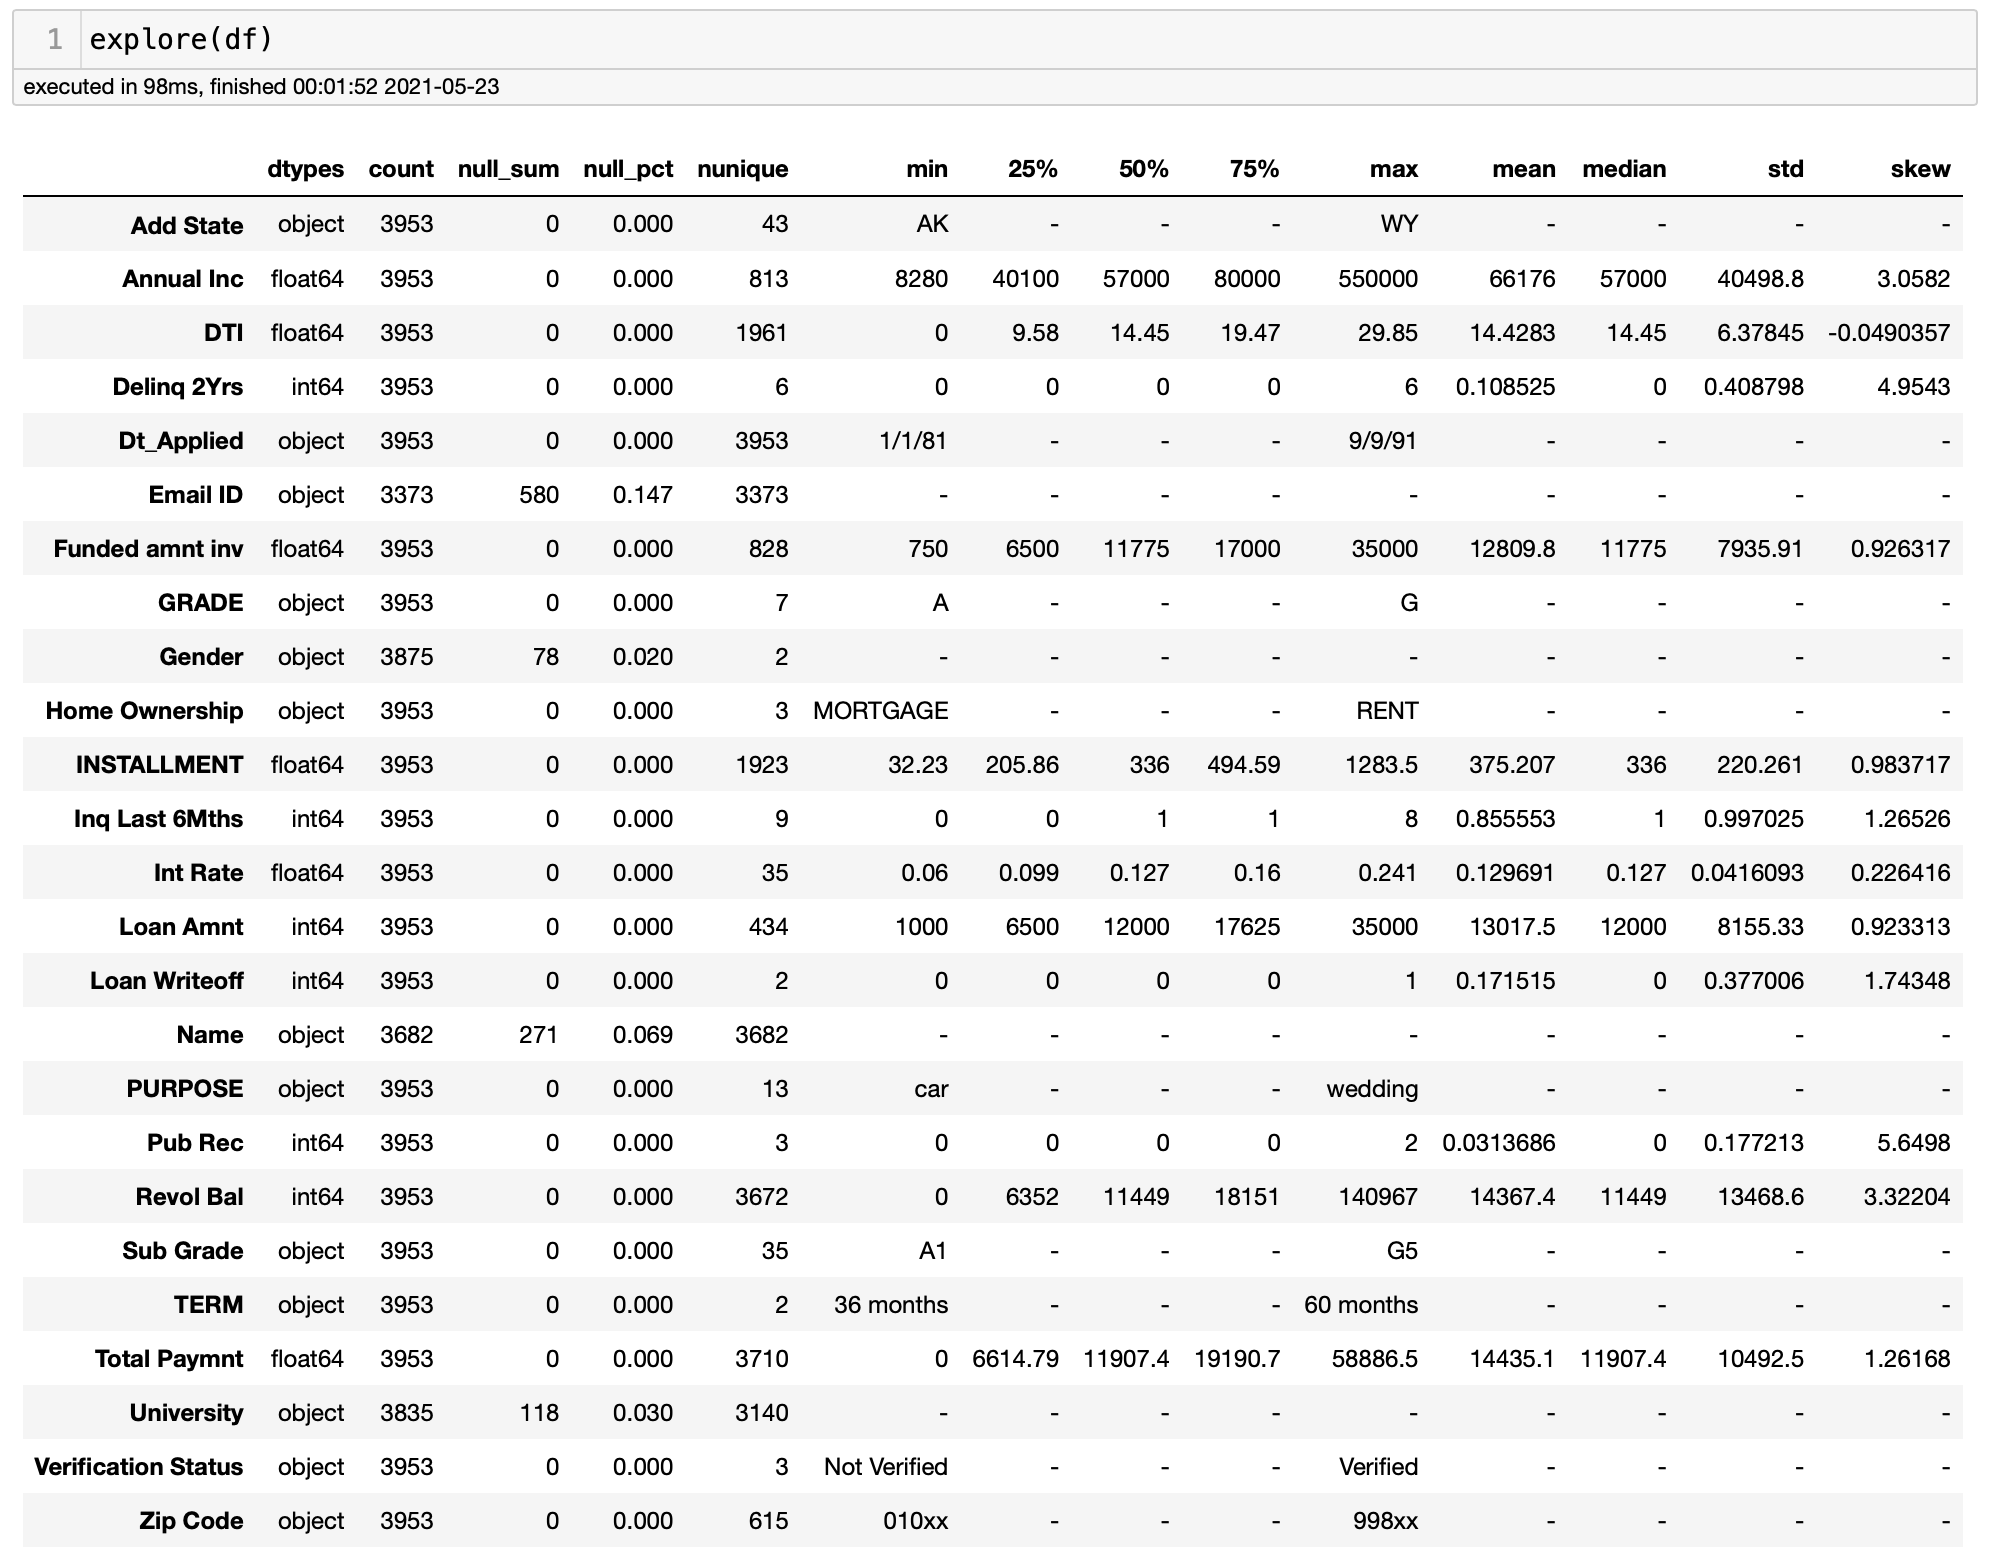
That was easy. In my opinion, this summarization table only would make it worth trying the library. There is also a skew column. This column shows the feature skewness. I have never used it in my data analysis because I check that through data visualization. However, it's nice to have. As we can see, explore(df) can return a lot of important information and save us from typing things such as df.dtypes, df.info, df.isnull.sum(), df.nunique(), df.skew(), and df.describe(). The best part is that everything is organized in one data frame. Awesome!
Not convinced yet? Don't worry about it! QuickDA got more to offer.
We can also get the data summarization more visually. Adding the parameter method = profile, QuickDA will generate an HTML file that summarizes all the columns and gives us insights into the dataset. You can add a name to your report by adding report_name = 'Name of the Report'. Let's explore this function.
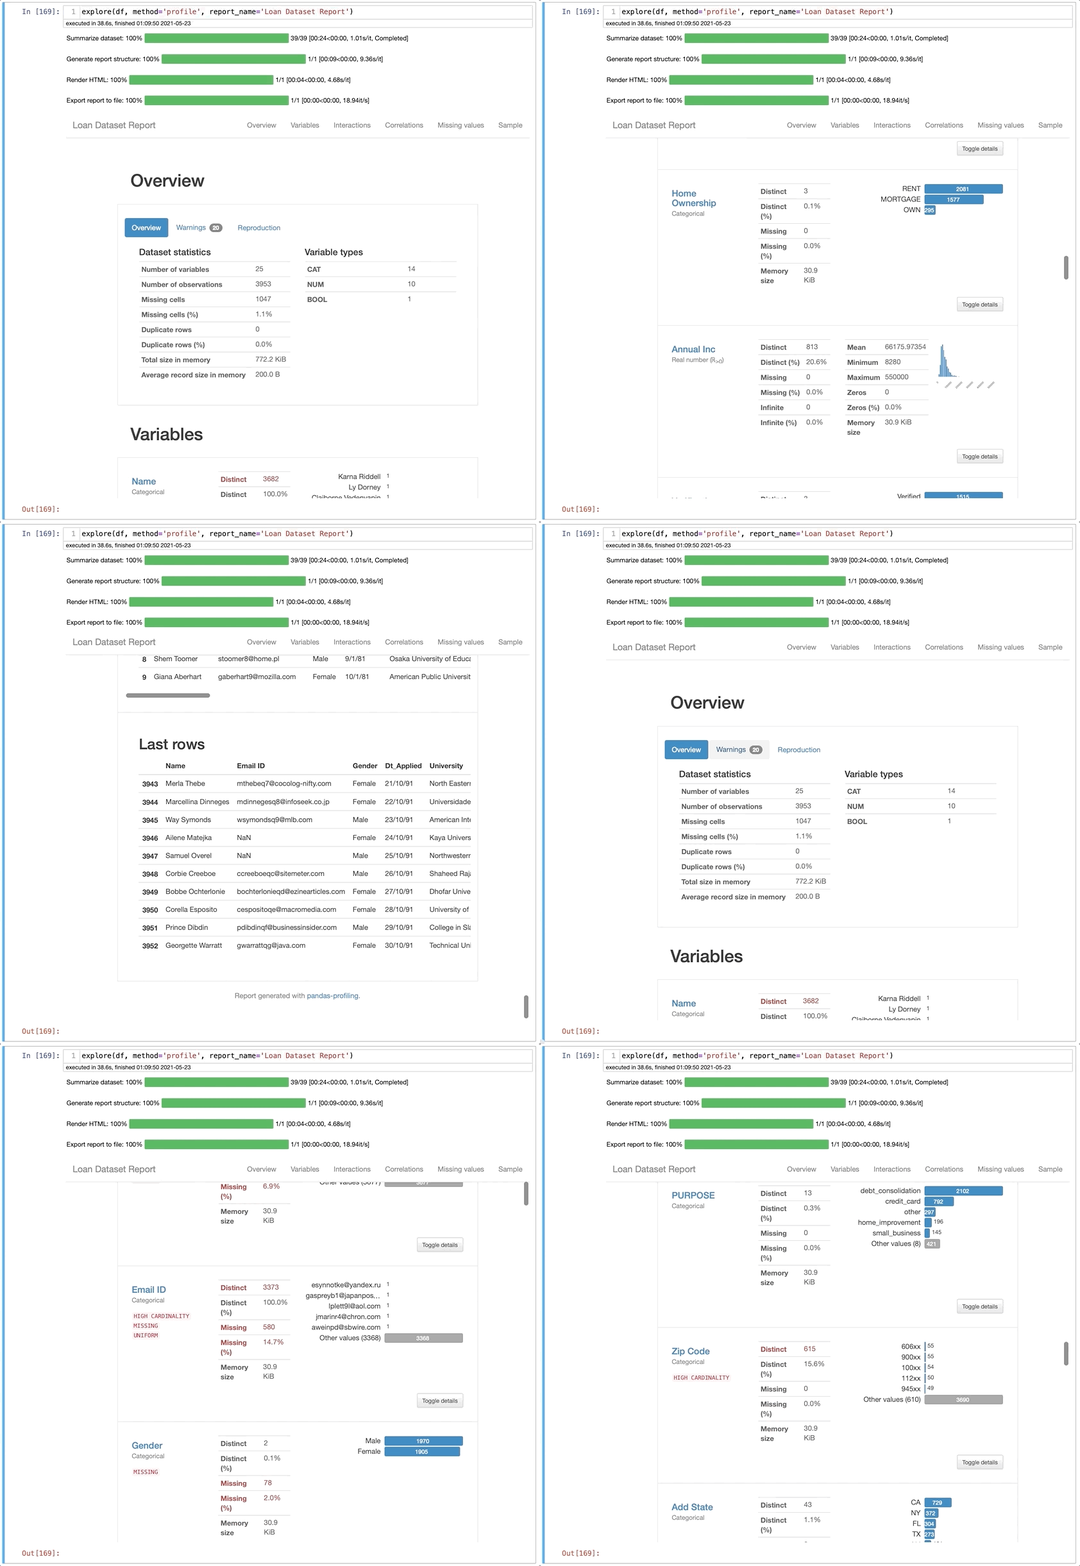
That is a lot of information. You can get more information about the feature by clicking on Toggle details. It will open descriptive statistics information about the dataset, common values, and even a feature visualization. In the example below, we can see a histogram, but this will depend on the type of data you have. Let's stick with this amazing function for a bit because there is a lot to explore here. You can also navigate the table using the navigation bar at the top.
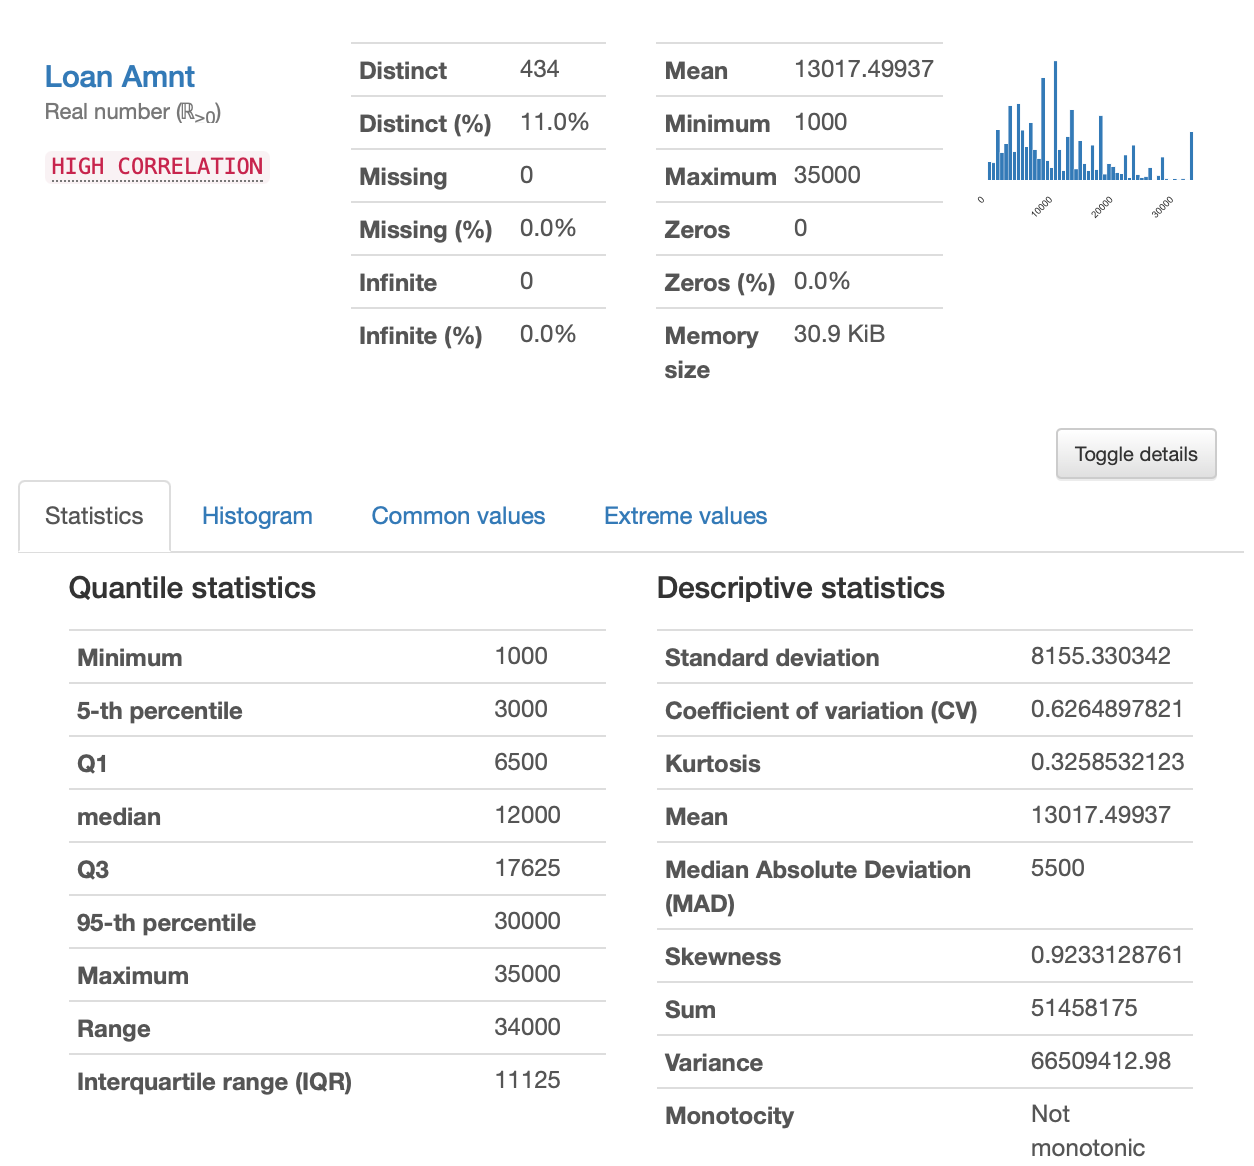
As I mentioned, you get a lot of descriptive statistics information and a better feature overview. It shows how much percent of the feature contains distinct, missing, and infinite values. Infinite values will not work with most of the modeling algorithms. The quantile statistics information is there and includes range, for example. This table below would be ten lines of code AT LEAST.
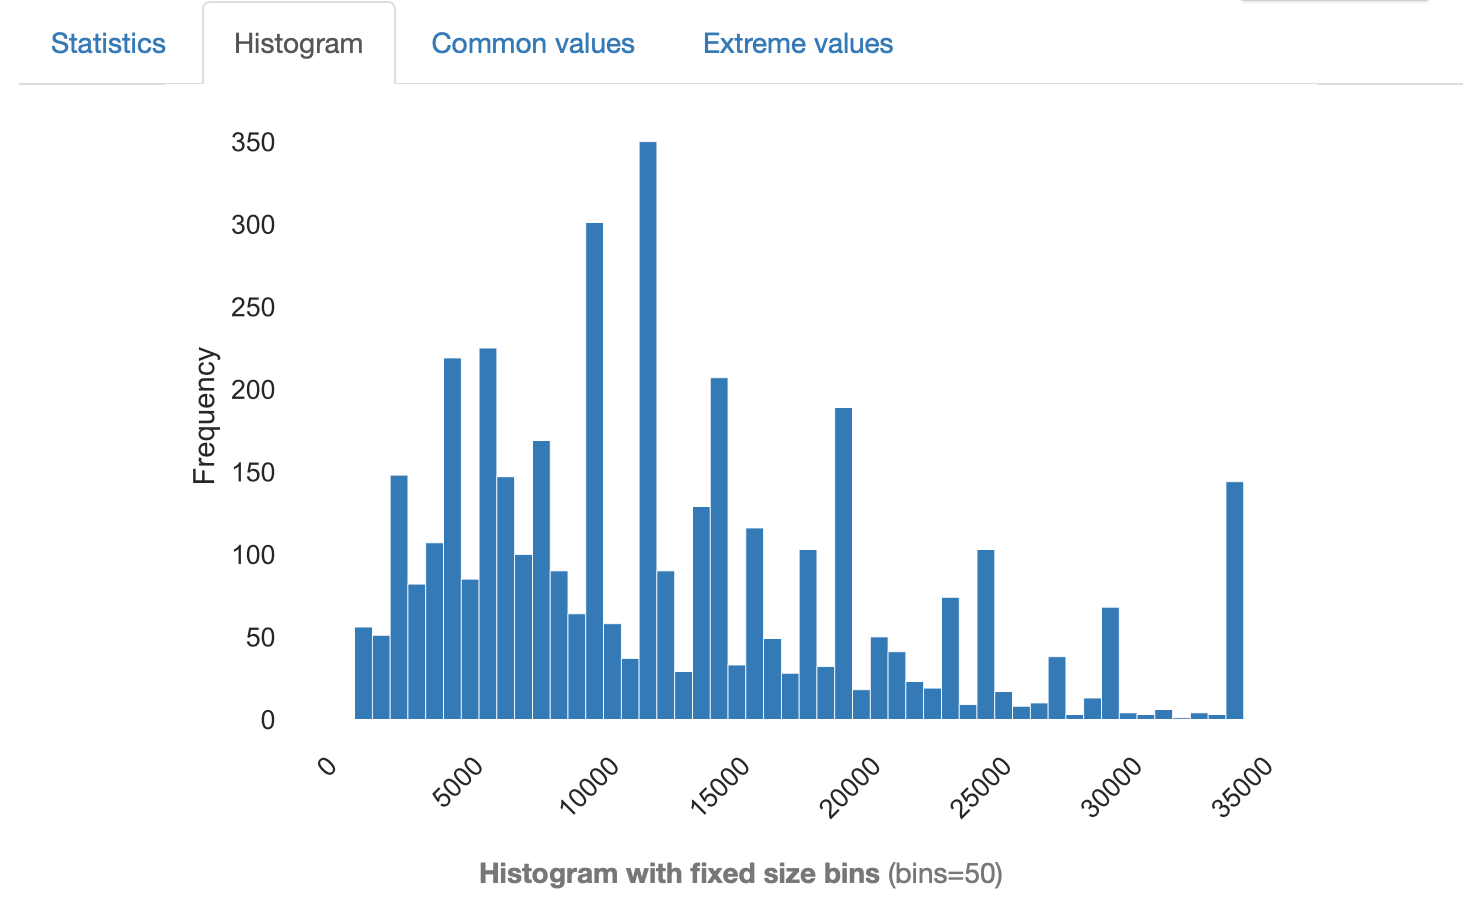
Clicking on Histogram, you will get a visualization of the feature. It looks good enough to be presented in a professional report.
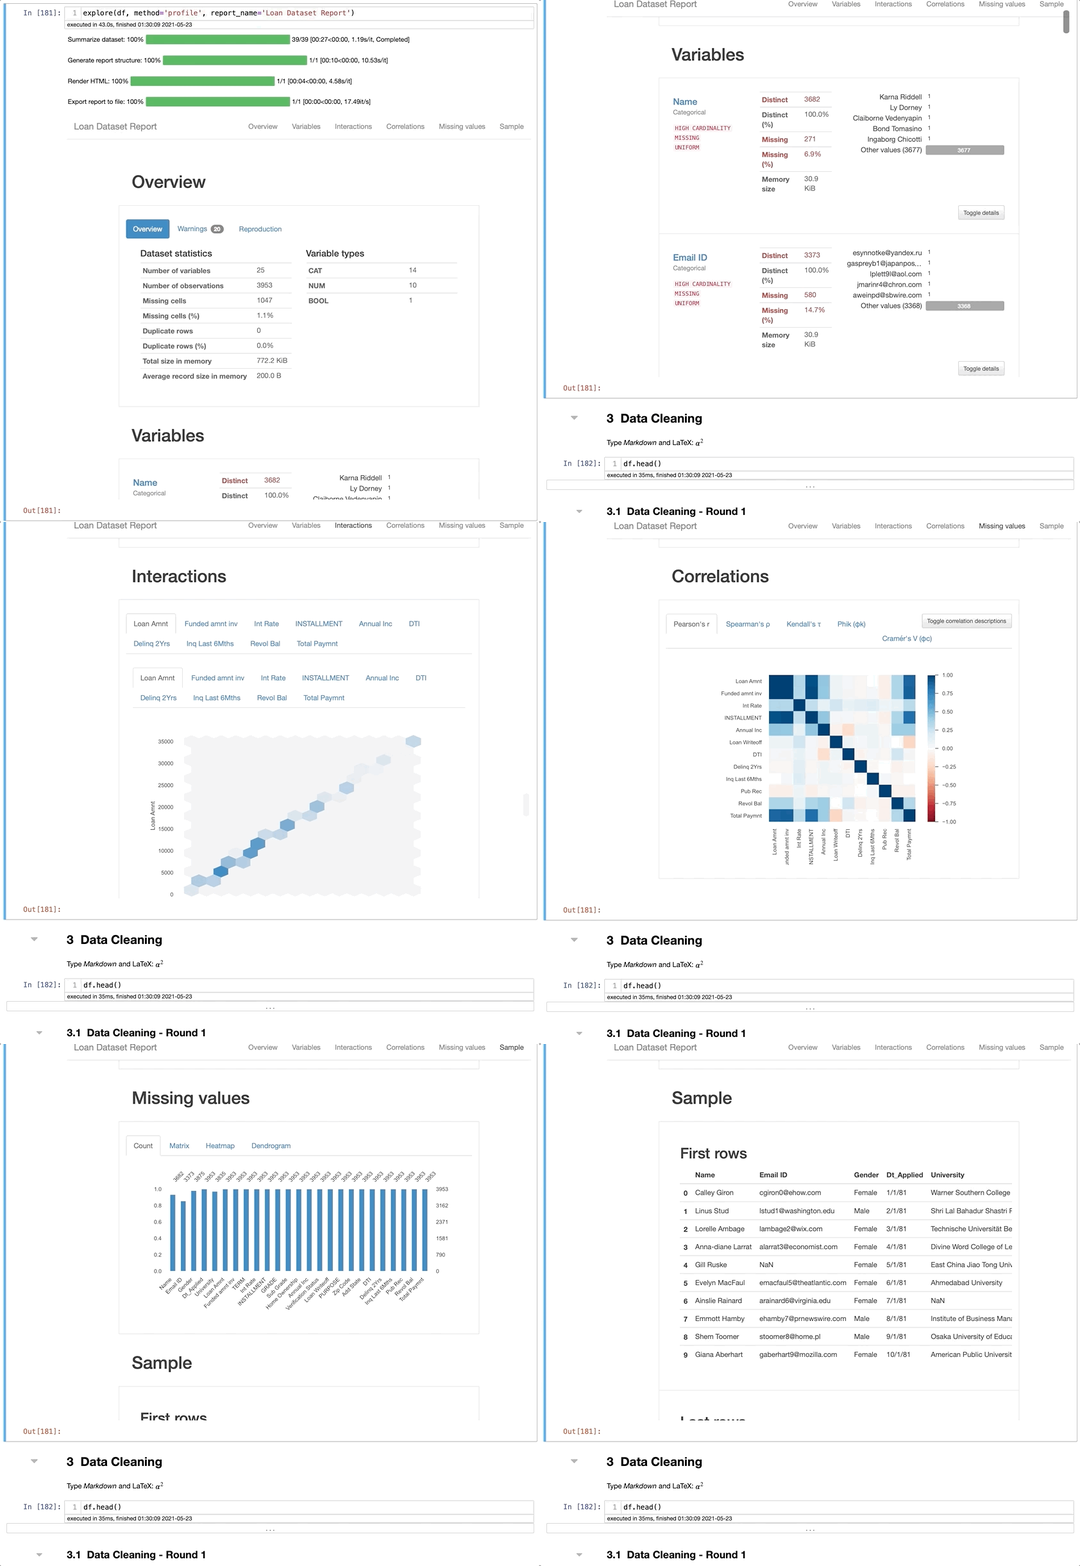
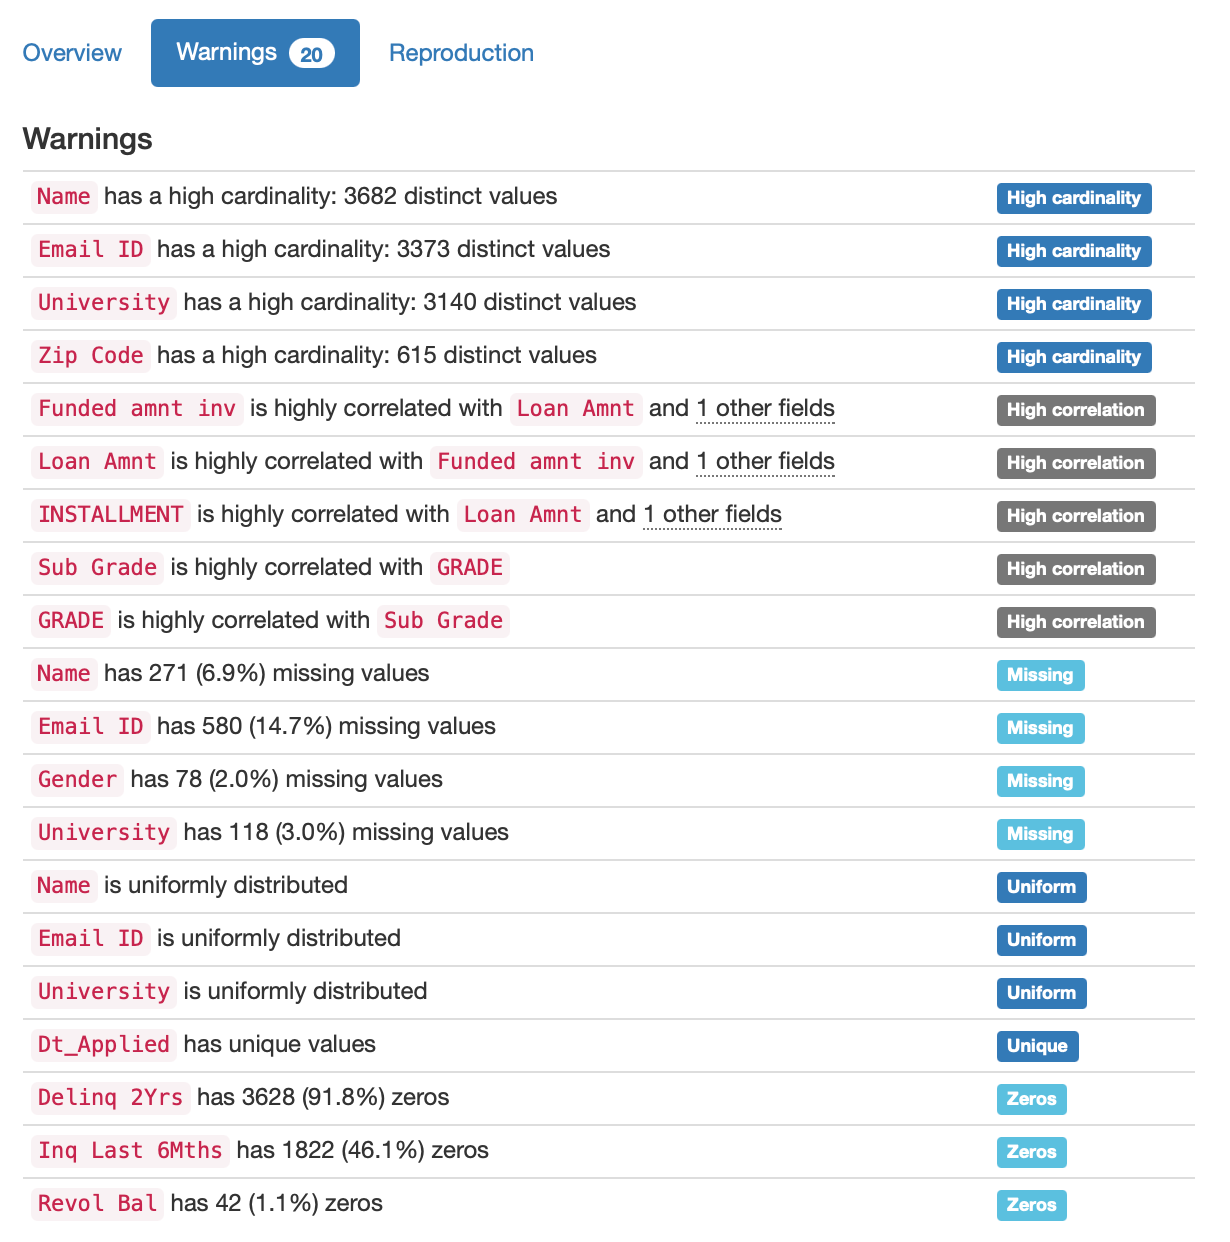
Another cool thing is that you can see the dataset warnings. It shows, for example, high cardinality, high correlation, missing values, uniform distributed values, and the percentage of zeros in the dataset. This will help a lot with the decisions you will take related to the project. Awesome, right?
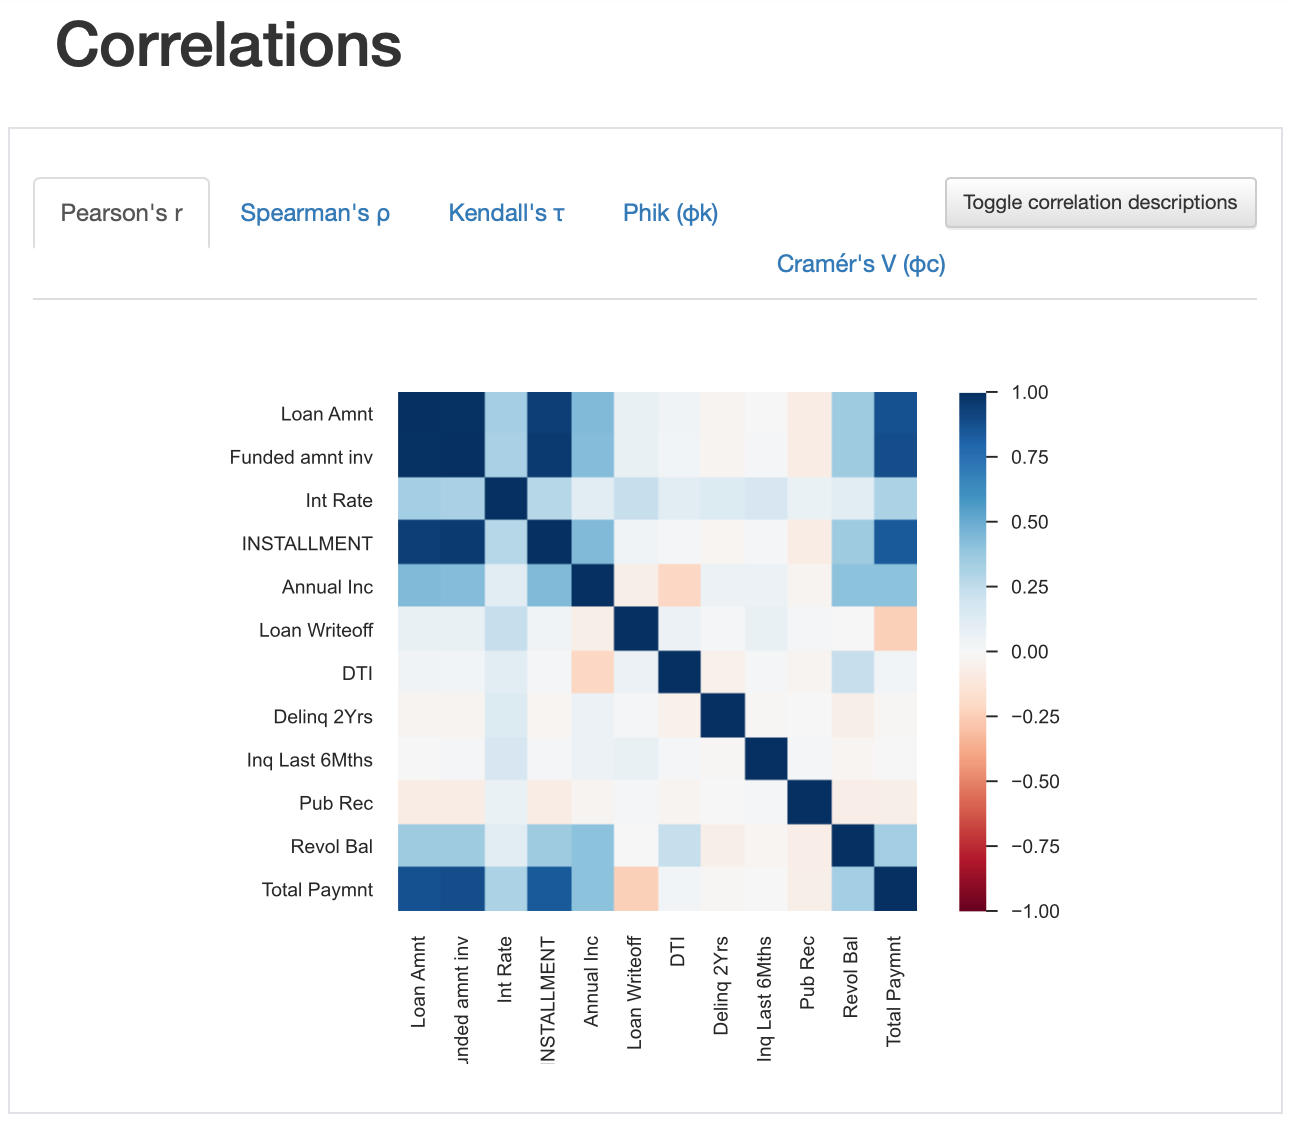
We will explore these data visualizations a little more later, but I want to mention that you can get a nice-looking visualization for the correlation. You can see that the xticks were edited - a very nice touch.
Data Cleaning
Let's switch gear a little bit and check the QuickDA's data cleaning capabilities. Some of these functions can be done quickly with Pandas. However, I want to show QuickDA's solutions as well.
Standardize Column Names
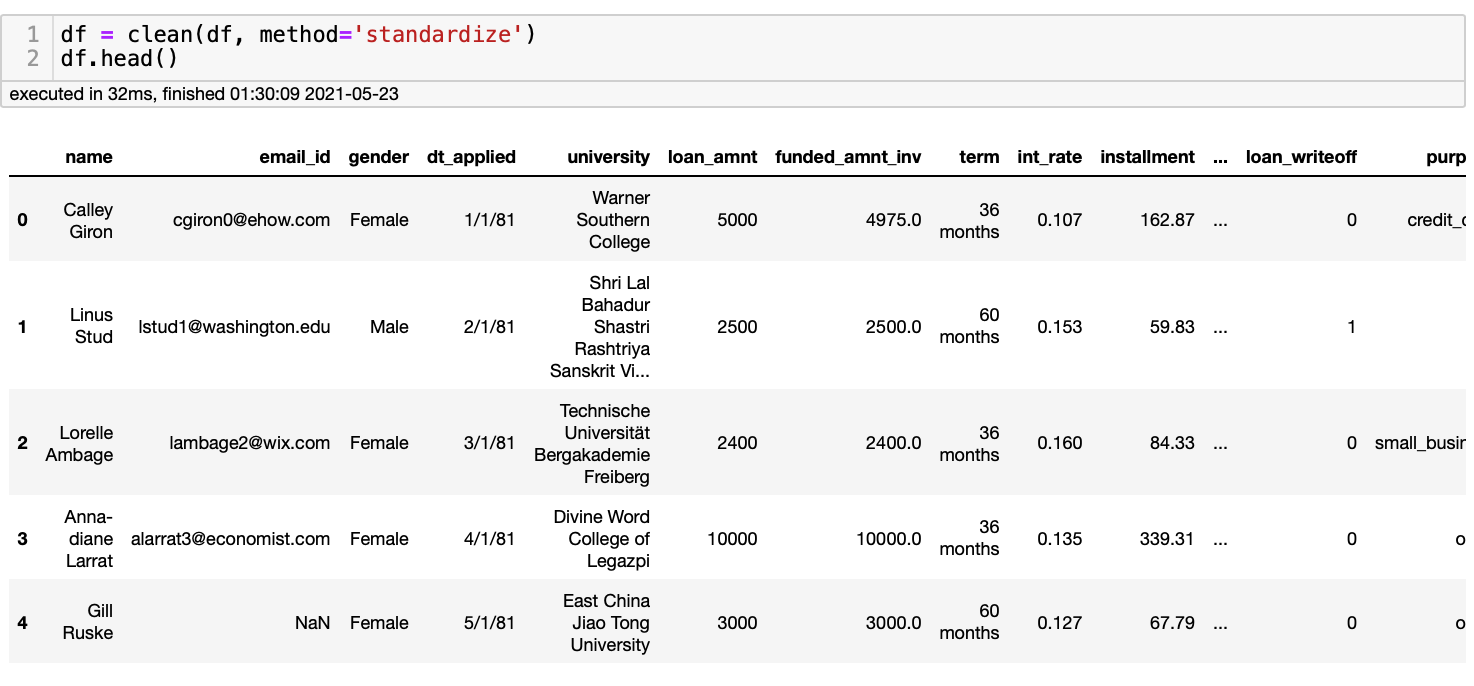
Everyone who has done a few exploratory data analyses has seen datasets with column names in different formats. Sometimes the names are capitalized or with spaces. We can easy solve this typing df = clean(df, method='standardize'). This line of code will lower case the column names and add an underline (_) if there are spaces. The code is as follow:
Dropping Columns
You can also drop the columns. I don't see any advantage compared to the regular Pandas .drop() function. However, if you want to standardize your code using only QuickDA, you have one more option.
Dropping Duplicated Values
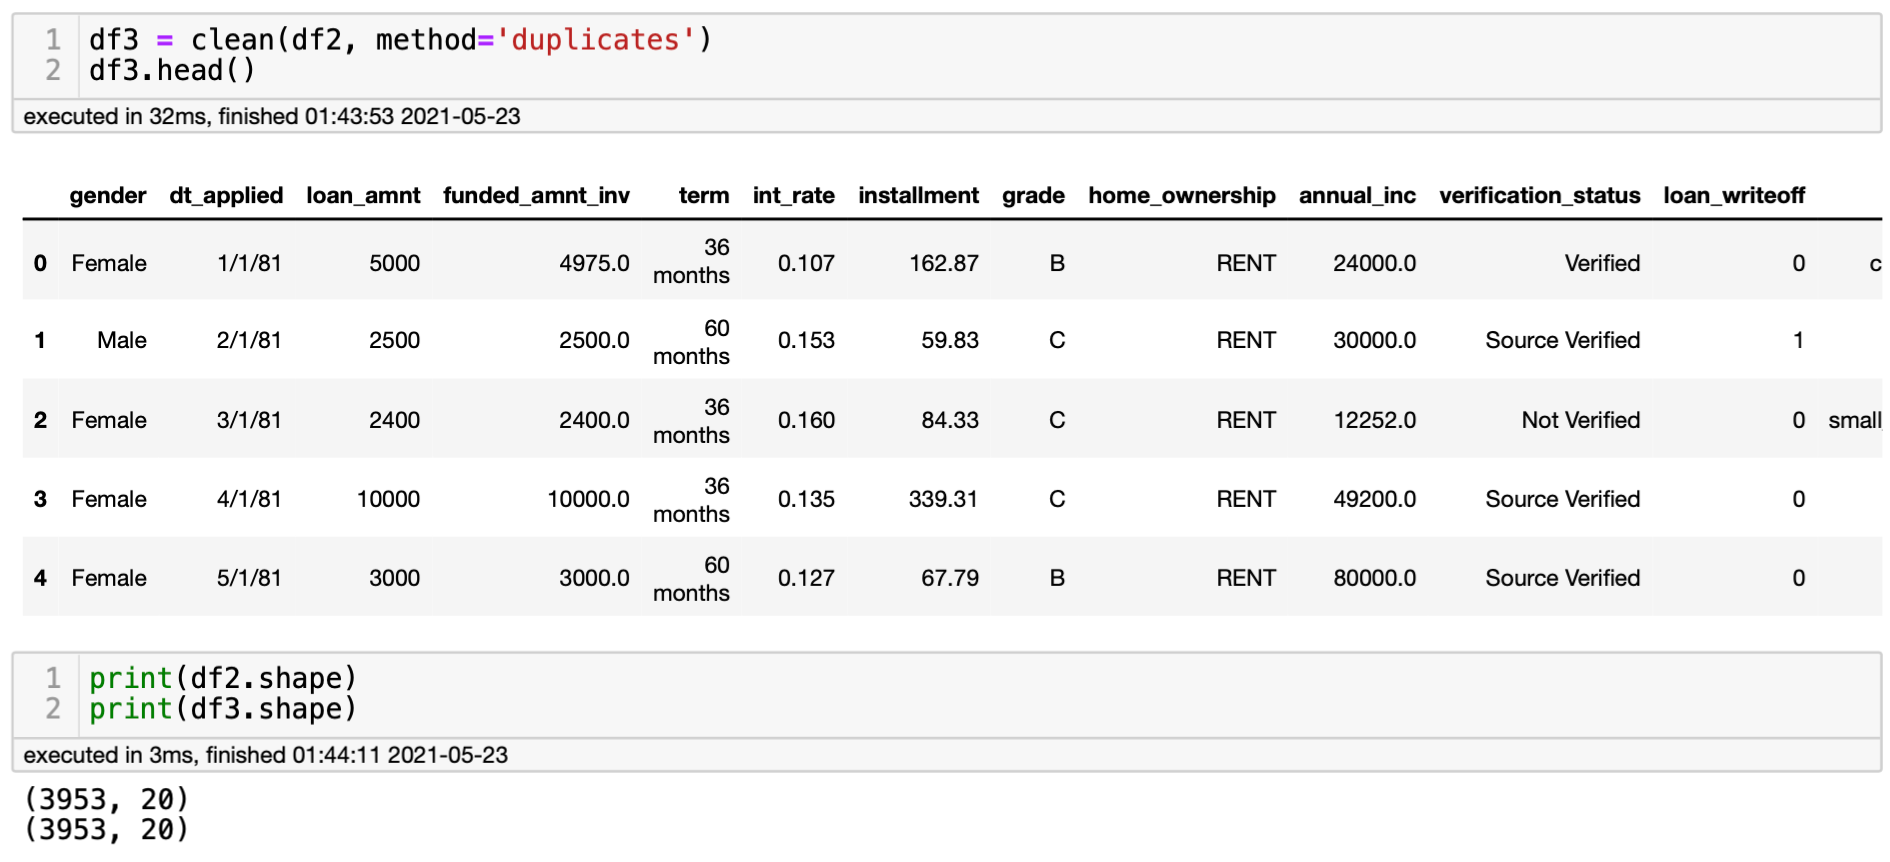
This dataset doesn't have duplicated values. Thus, we will not see any differences when applying this line of code.
Renaming Values
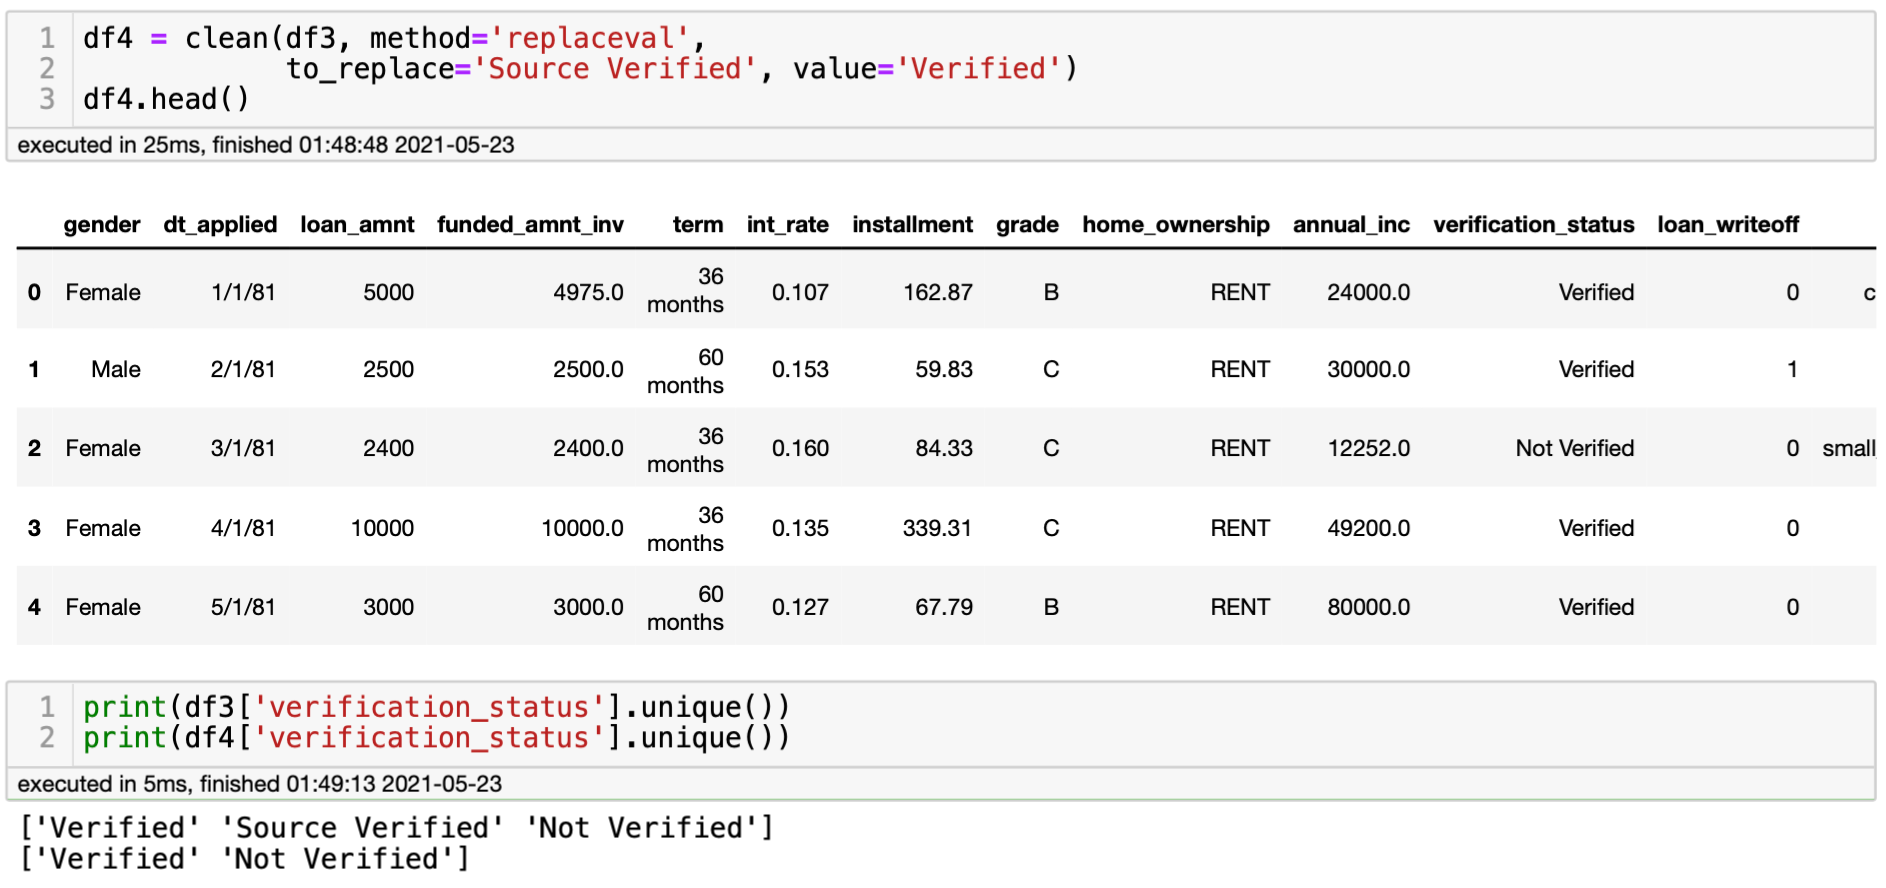
We can also easily replace values in the columns with QuickDA. Pandas does have the .replace() function that is also easy to use. However, QuickDA is also very easy to use. In this case, I will replace the values Source Verified into Verified.
Fill Missing Values
Missing values? No problem, QuickDA is also able to deal with it through interpolation. Interpolation is an estimation of a value within two known values in a sequence of values. To do so, you can use the following code:
Remove Outliers
It's debatable when we should remove outliers. Sometimes the data is incorrect and sometimes outliers are important to understand all the scenarios. Nevertheless, if you decide that outliers are not important, you can delete them with the following code:
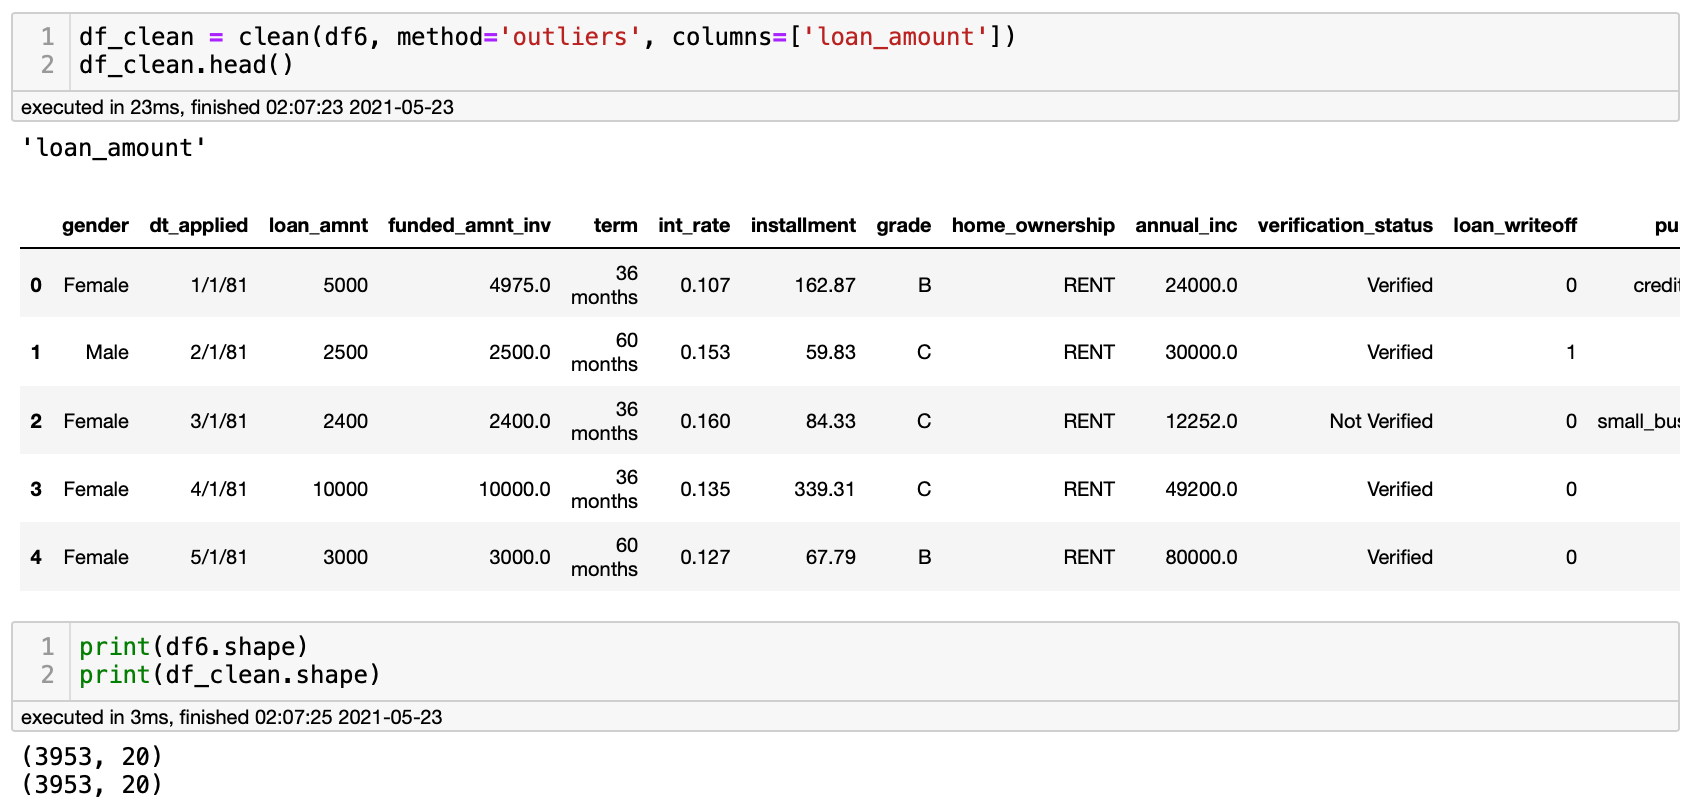
You can choose which columns you want to remove the outliers. If you don't select a column, QuickDA will delete the outliers from all the columns.
To Be Continued
We just saw a lot of exciting information, and there is a lot more to show you. However, this blog was becoming a bit too long. For this reason, I will write part two, where I will show you a lot more exciting stuff that we can do with QuickDA. For example, how to create data visualizations with it. Stay tuned, and I will publish it in the next few days.
Update: As promised, I have written a second blog focused on the data visualizations. You can find it here: How to Create Data Visualizations in Python With One Line of Code
Final Thoughts
QuickDA is one of the most incredible Python libraries that I have seen. Usually, when I try new libraries, there are ups and downs. However, I have only had positive experiences with QuickDA. It just works, and it's 100% worth trying. I highly recommend you try it with your own dataset and feel the magic. I promise you that you will save hours. You can find the code on this blog and much more in this notebook.
Your feedback is important to me. Let me know how it goes. I can wait to see how you will be using this fantastic library. Happy coding!