

Heatmaps are a powerful visualization tool that can help you understand complex data sets by representing values as colors. The primary element of heatmeaps is the use of color. The right color palette can highlights subtle difference in the data, emphasize the relationships and make the heatmap more accessible and insightful. Seaborn can supports numerous color palette which can be tailored to specific needs. Whether it can be distinguishing between the high and low values, highlighting the mid range data or enhancing readability for the colorbind users.
In this article, we will explore how to effectively assign the colors to value in the Seaborn heatmaps.
Table of Content
Basics of Color Mapping in Heatmaps
Heatmap is a graphical representation of the data where individual values contained in the matrix are represented as colors. The color mapping or colormap is the crucial because it can provides the visual shorthand for complex information. Seaborn can be leveraging the matplotlib's capabilities and enables the detailed customization of this color mapping. The cmap Parameter is the Key to Color Customization.
Seaborn allows the use of different types of the color palettes and it can be classified into three types:
1. Sequential
It can be color palettes that progress from light to dark and it can be ideal for data with the natural order. Example: Blues, Greens and Greys.
Syntax:
sns.heatmap(data, cmap='Blues', annot=True)This palettes are perfect for ordered data where the values progress from low to high. They can use the shades of the single color, transitioning from light to dark to symbolize the increasing values. It can be mostly used for highlightling magnitude such as in temperature data.
2. Diverging
Palettes that use contrasting the colors from the cental point to emphasize deviation. It can be suitable for data centered around a critical value like zero.Example: coolwarm, RdBu.
Syntax:
sns.heatmap(data, cmap='coolwarm', annot=True, center=0)This palette can be used when data revolves around the central value, often zero. They feature can be two contrasting color that intensity away from the center. It can effectively highlightling positive and negative deviations from the midpoint.
3. Qualitative
It can be palettes with distinct colors to differentiate non ordered categories and enhancing the contrast and clarity. Example: set1 and paired.
Syntax:
sns.heatmap(data, cmap='Set1', annot=True)This palette are suitable for the categorical data without inherent order. they can use distinctly different colors to differentiate categories clearly.It can be useful for data like survey responses or categories.
Example 1 : Different Colormaps to Assign Colors to Values in a Heatmap
This example can demonstrates the use of each type of color palette(sequential, diverging, and qualitative) in the seaborn heatmaps. This example includes the sample data appropriate for each palette type and generate the visualizarions.
import seaborn as sns
import matplotlib.pyplot as plt
import numpy as np

# Generate sample data
data_sequential = np.array([[10, 20], [20, 30]])
data_diverging = np.array([[1, -1], [-2, 2]])
data_qualitative = np.array([[0, 1], [2, 3]])

# Set up the matplotlib figure
plt.figure(figsize=(12, 10))

# Plot a heatmap using a sequential color palette
plt.subplot(311)  # 3 rows, 1 column, 1st subplot
sns.heatmap(data_sequential, cmap='Blues', annot=True)
plt.title('Sequential Color Palette')

# Plot a heatmap using a diverging color palette
plt.subplot(312)  # 3 rows, 1 column, 2nd subplot
sns.heatmap(data_diverging, cmap='coolwarm', annot=True, center=0)
plt.title('Diverging Color Palette')

# Plot a heatmap using a qualitative color palette
plt.subplot(313)  # 3 rows, 1 column, 3rd subplot
sns.heatmap(data_qualitative, cmap='Set1', annot=True)
plt.title('Qualitative Color Palette')

# Display the plots
plt.tight_layout()
plt.show()
Output:
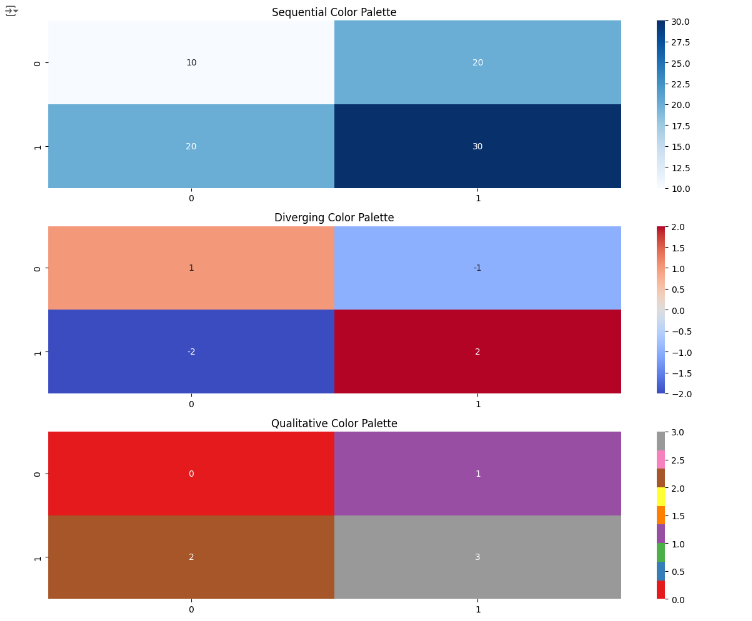
The code generates three types of the seaborn heatmaps:
- Sequential Palette: It can uses the Blues palette for the heatmap that shows increasing values and suitable for displaying the gradients in data, suitable for ordered data.
- Diverging Palette: It can applies the coolwarm palette to the heatmap with values around the zero, highlighting various with contrasting colors, useful for data with a meaningful zero point and values diverging in two directions.
- Qualitative Palette: It can be uses the Set1 palette for categorical data and differntiating the categories with distinct colors, ideal for categorical data.
By using these different colormaps ('Blues', 'coolwarm', 'Set1'), the code snippet effectively illustrates how to choose and apply appropriate color assignments in Seaborn heatmaps based on the nature of the data being visualized. This aligns with the title by demonstrating practical methods for color assignment that enhance the clarity and interpretability of heatmap visualizations.
Example 2 : Custom Colormap for Specific Values Mapped to Predefined colors
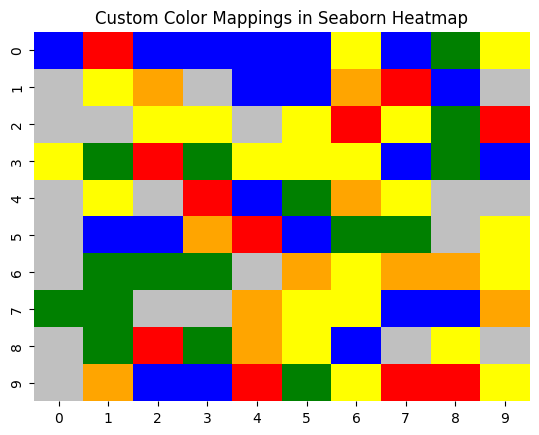
the code snippet because it exemplifies a methodical approach to assigning colors to specific values in a heatmap:
- Definition of Color Dictionary: Shows how to map individual values to specific colors using a dictionary (
cmap_dict). - Creation of Custom Colormap: Illustrates how to convert this dictionary into a custom colormap (
cmap) suitable for use in Seaborn. - Application in Heatmap Plotting: Demonstrates the practical implementation of the custom colormap to visualize data in a heatmap.
- Interactive Color Mapping: Added a
define_color_mapping()function that prompts the user to input colors for each value from 0 to 5. This makes the colormap interactive and customizable.
import seaborn as sns
import matplotlib.pyplot as plt
import numpy as np

# Function to interactively define color mappings
def define_color_mapping():
    print("Define color mappings for values 0 to 5:")
    cmap_dict = {}
    for i in range(6):
        color = input(f"Enter color for value {i}: ").strip()
        cmap_dict[i] = color
    return cmap_dict

data = np.random.randint(0, 6, size=(10, 10))

# Get custom color mappings interactively
cmap_dict = define_color_mapping()
cmap = sns.color_palette([cmap_dict[i] for i in range(6)])

sns.heatmap(data, cmap=cmap, vmin=0, vmax=5, cbar=False, annot=False)
plt.title('Custom Color Mappings in Seaborn Heatmap')
plt.show()
Output:
Define color mappings for values 0 to 5:
Enter color for value 0: blue
Enter color for value 1: yellow
Enter color for value 2: orange
Enter color for value 3: green
Enter color for value 4: silver
Enter color for value 5: red
Best Practices for Color Customization
When customizing colors in a heatmap, consider the following best practices:
- Choose the Right Color Palette: Select a color palette that enhances the readability of your data. Use sequential palettes for data with a natural ordering, diverging palettes for data with a critical midpoint, and qualitative palettes for categorical data.
- Handle Missing Data Thoughtfully: Decide how to represent missing data to avoid misleading the viewer. Use distinct colors or patterns to highlight missing values.
- Properly Scale Your Data: Normalize or scale your data to ensure that the heatmap accurately reflects differences across the dataset. Techniques like min-max scaling, Z-score normalization, or log transformations can be beneficial.
- Use Annotations Sparingly: While annotations can add valuable detail, overcrowding your heatmap with annotations can make it hard to read. Limit annotations to key data points or use them in smaller heatmaps.
- Adjust Heatmap Dimensions: Customize the size and aspect ratio of your heatmap to ensure that each cell is clearly visible and the overall pattern is easy to discern.
Conclusion
Assigning colors to values in a Seaborn heatmap allows you to create more informative and visually appealing data visualizations. By using built-in colormaps, creating custom color palettes, and mapping specific values to colors, you can enhance the clarity and consistency of your heatmaps. Remember to follow best practices for color customization to ensure that your visualizations effectively communicate the insights in your data.
