

A Pivot Table in Google Sheets is a powerful data analysis tool that helps you quickly summarize, organize, and extract insights from large datasets. It allows you to group data, apply filters, and perform calculations like SUM, COUNT, and AVERAGE, making it easier to identify patterns, trends, and key metrics for better decision-making.
How to Create a Pivot Table in Google Sheets
Follow this Google Sheets pivot table tutorial to quickly make a Pivot Table:
Step 1: Select the Data Range
Highlight the data range you want to include in the pivot table. For example, select A2:D9.
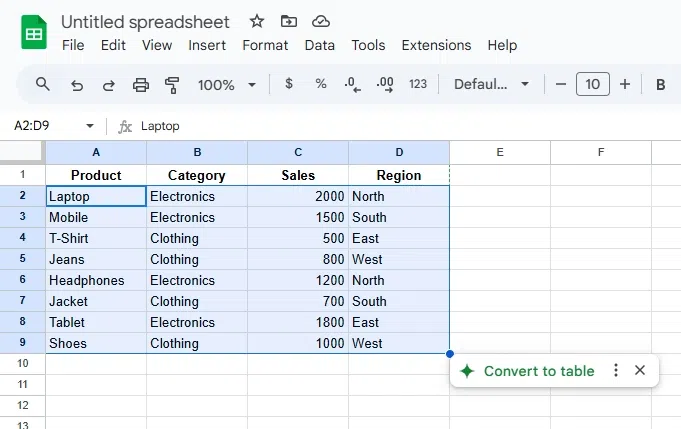
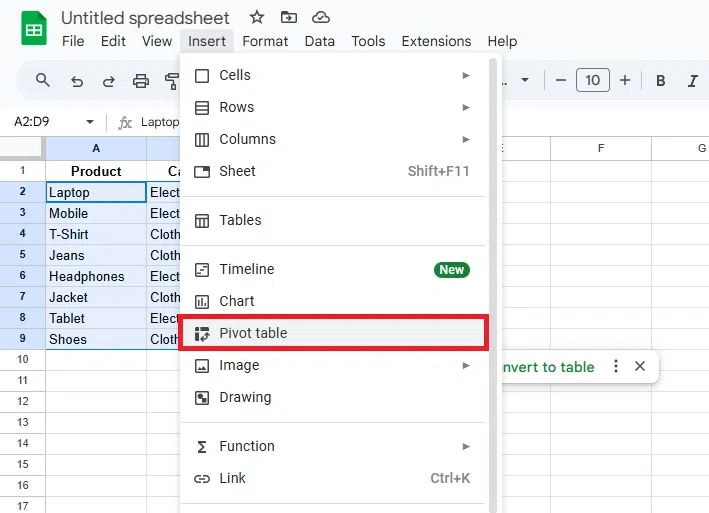
Step 2: Open the Pivot Table Option
Go to the menu bar, click on Insert, and choose Pivot Table.
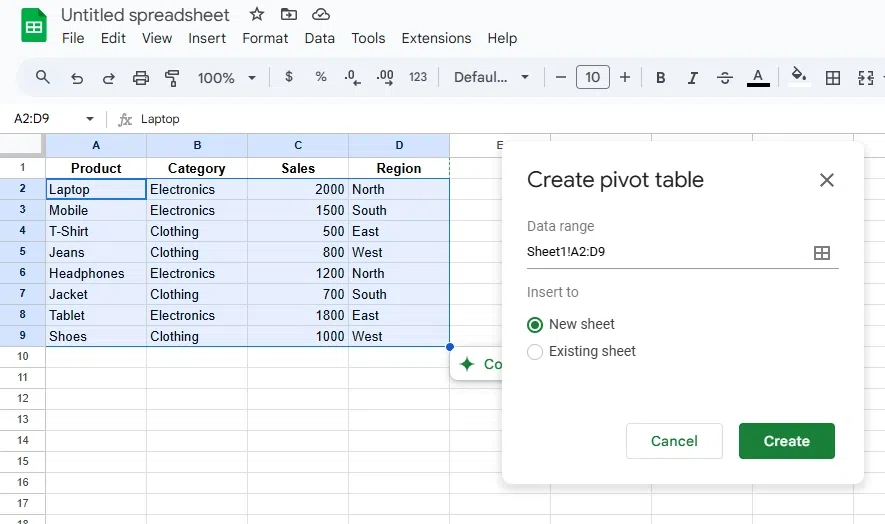
Step 3: Choose the Location for the Pivot Table
In the pop-up window, decide whether to place the pivot table in a new sheet or the existing one. Click Create.
Step 4: Add Rows to the Pivot Table
In the Pivot Table Editor, click Add under the Rows section. Select "Category" to group data by category (e.g., Electronics and Clothing).

Step 5: Add Columns to the Pivot Table
Click Add under the Columns section and select "Region" to categorize data by region.
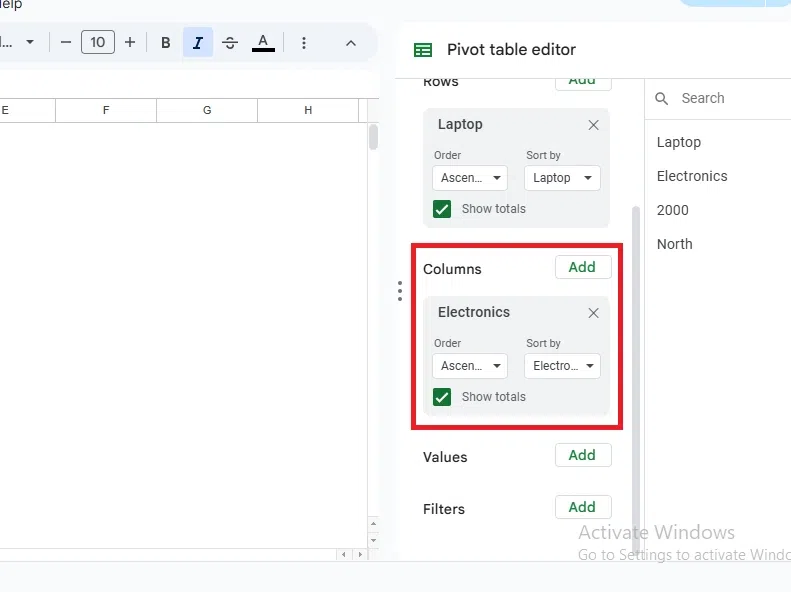
Step 6: Add Values to the Pivot Table
Click Add under the Values section and select "Sales." Ensure the summarization is set to "SUM" to display total sales.
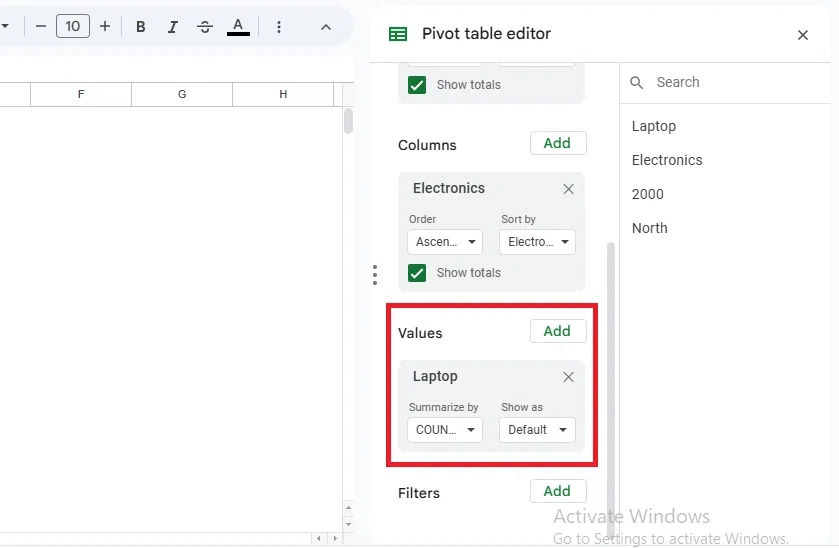
Step 7: Analyze the Pivot Table
Review the generated pivot table. It will summarize sales by category and region, helping you draw insights quickly.

How to Create a Pivot Table from Multiple Sheets in Google Sheets
This Google Sheets pivot table tutorial will guide you on how to create a pivot table using data from multiple sheets. It allows you to combine and analyze data from different sources in one place. Ideal for scenarios like comparing sales data from different regions or departments stored in separate sheets.
Step 1: Organize Data in Separate Sheets
Ensure the data you want to include in the pivot table is spread across multiple sheets, like "Sales Data" in Sheet 1 and "Category Data" in Sheet 2.
Step 2: Combine Data Using QUERY or ARRAYFORMULA
To use data from multiple sheets in a pivot table, you must combine it into one sheet.
In a new sheet (e.g., Combined Data), use the QUERY function:
=QUERY({Sheet1!A2:C, Sheet2!B2:B}, "SELECT Col1, Col2, Col3, Col4") This combines the data into one table.
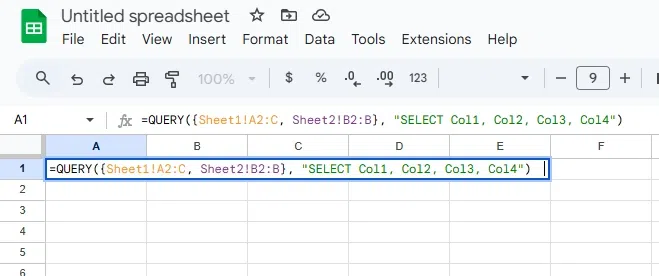
Step 3: Select the Data Range for the Pivot Table
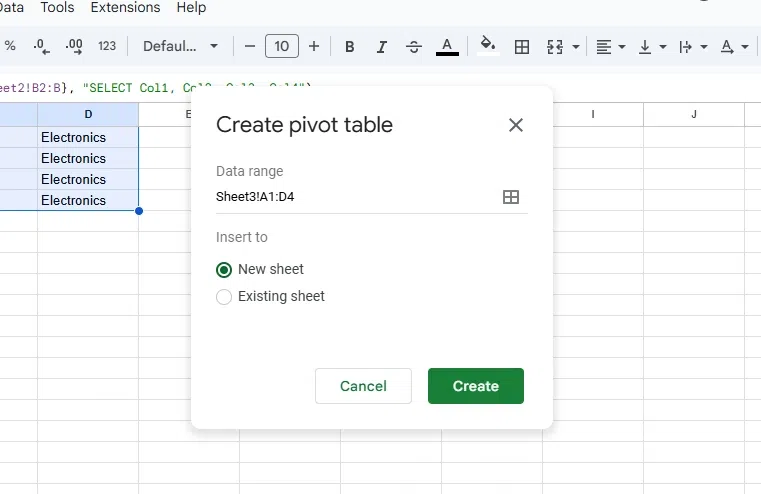
Highlight the combined data in the new sheet, e.g., A1:D4.
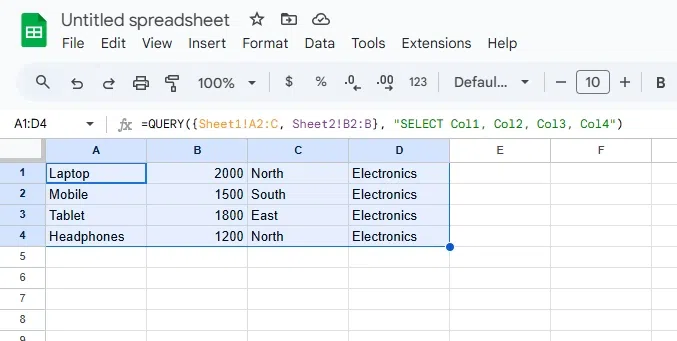
Step 4: Insert the Pivot Table
Go to the menu bar, click Insert, and select Pivot Table.
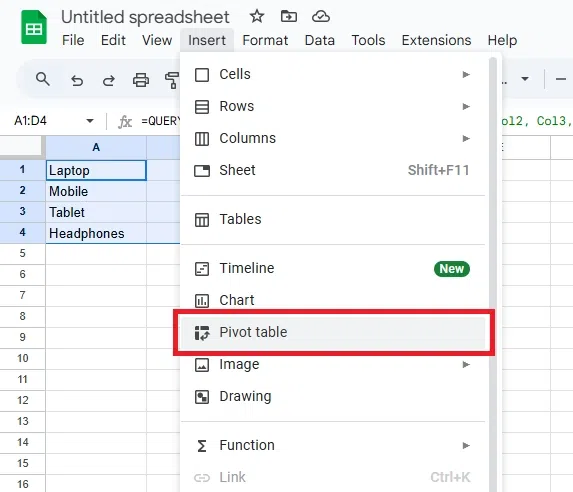
Step 5: Choose the Location for the Pivot Table
In the pop-up window, choose whether to place the pivot table in a new sheet or the existing one, then click Create.
Step 6: Add Rows to the Pivot Table
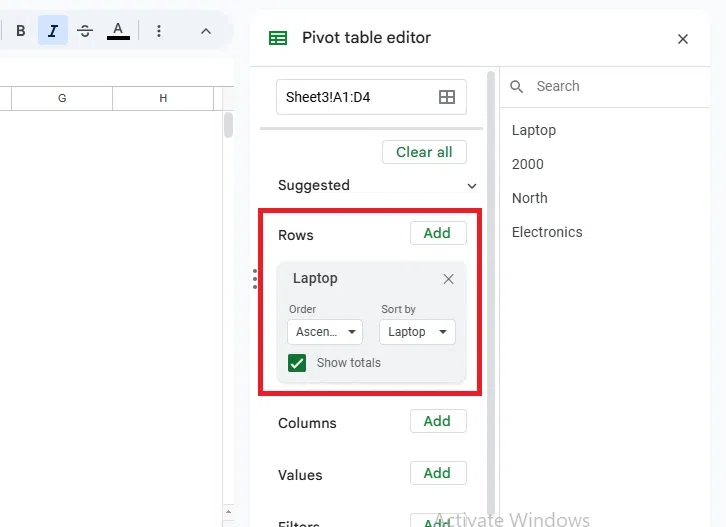
In the Pivot Table Editor, click Add under the Rows section. Select "Category" to group data by product categories.
Step 7: Add Columns to the Pivot Table
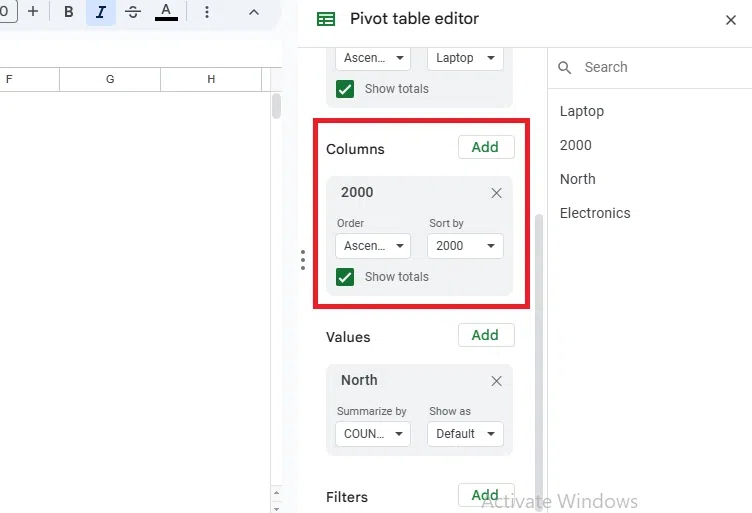
Click Add under the Columns section and select "Region" to categorize data by sales regions.
Step 8: Add Values to the Pivot Table
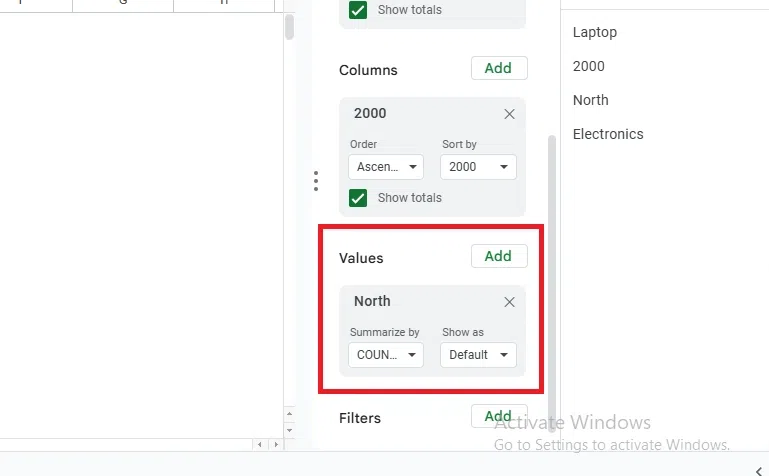
Click Add under the Values section and select "Sales." Set the summarization to "SUM" to calculate total sales.
Troubleshooting Common Issues
Here are some common problems with Pivot Tables in Google Sheets and their solutions:
| Issue | Cause | Solution |
|---|---|---|
| Pivot Table Not Updating | Source data has changed but the pivot table hasn’t. | Click anywhere on the pivot table and press Refresh in the Pivot Table Editor. |
| Data Range Error | Incorrect or incomplete data range selected. | Check and update the data range by clicking Edit Data Range in the Pivot Table Editor. |
| Missing Data in Pivot Table | Blank cells or mismatched formatting in the source. | Ensure the source data is clean, with no blank rows or mismatched formats. |
| Duplicate Data Entries | Duplicate rows in the source dataset. | Remove duplicates using the Data > Remove Duplicates feature. |
| Cannot Group Data | Text data in a column intended for numerical grouping. | Convert text to numbers, or use a helper column with the correct format. |
| #REF! or #VALUE! Errors | Invalid formulas or references in the source data. | Fix errors in the source data before creating the pivot table. |
Tips for Preventing Issues
- Always keep your source data organized and properly formatted.
- Use filters to remove unnecessary data before creating the pivot table.
- Regularly refresh the pivot table to ensure it reflects the latest updates.
By addressing these issues, you can maintain smooth and accurate Pivot Table functionality in Google Sheets.
