

Sysmon is a graphical system monitor for Linux. It shows the information about the CPU, GPU, Memory, HDD/SDD and network connections. It is similar to the Windows task manager. It is completely written into the python programming language. Sysmon shows the all information in the form of Graphical visualization. There are some features of these tools: CPU utilization and per-core clock speed, GPU utilization and clock speed, Memory and Swap utilization, Network utilization (Wlan and Ethernet). Wlan link bandwidth is constantly updated., HDD/SSD utilization.
- CPU: How much processing is being utilized and the speed of each core.
- GPU: How intensely your graphics card is working and its clock speed.
- Memory: How much RAM and swap space (virtual memory) are utilized.
- Storage: Activity on your hard drive or SSD.
- Network: Data usage for Wi-Fi and Ethernet, with real-time updates on Wi-Fi signal strength.
Why Use Sysmon?
Sysmon is wonderful in that it gathers this data in one location, with clear graphs and charts. As a casual user or computer buff, it helps you identify problems such as a program consuming memory or a flaky network connection. It's also light on resources and won't bog down your system.
Installation of Sysmon
Before installing Sysmon, we need to look at the dependencies required. The Following two are the dependencies.
Step 1: Install Python 3 and pip3
Depending on your Linux distribution, the commands to install Python 3 and pip3 vary
For Ubuntu or Debian based system:
sudo apt install python3
sudo apt-get install python3-pip
For Fedora OS:
dnf install python3For Arch Linux Based Systems:
pacman -S python-pip For openSUSE:
zypper install python3-pipNow let's see the installation process of the Sysmon. To install the sysmon on the Linux system use the following command:
pip3 install sysmon or
pip install sysmon 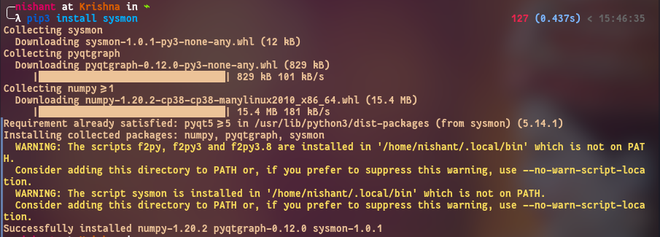
Now we have installed Sysmon our Linux system. Now let's see how to use the sysmon.
Using Sysmon
Now that Sysmon is installed, let’s get it running it:
Step 1: Launch Sysmon
To start Sysmon, open your terminal and simply type:
sysmon
In the above image, we can see the all data about currently running processes.

In the above image, sysmon shows all information about the CPU and memory.
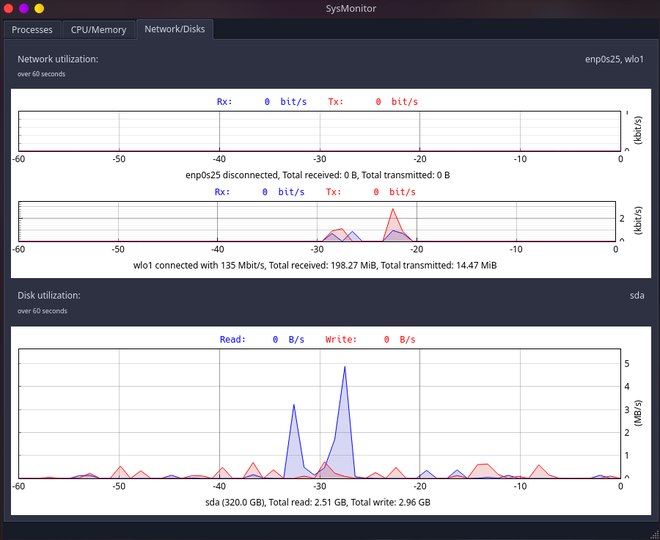
In the above image, we can see that the sysmon show the all information about the network.
Step 2: Understand the Interface
Sysmon's interface contains a lot of sections and all displaying real-time information about another aspect of your system:
- CPU Tab: It indicates that how much of your processor is utilized and also display the speed of every core.
- Memory Tab: It indicates the RAM and swap usage. It indicates that why your system feels slow when your memory is nearly full.
- Storage Tab: Here user can monitor activity on your hard drive or SSD, such as reading or writing data.
- Network Tab: It displays regarding the data usage of Wi-Fi and Ethernet and the Wi-Fi signal strength too. It is great for problems related to slow internet.
- GPU Tab (if applicable): It is simply monitoring your graphics card's load and speed, which is helpful while gaming or video editing.
Step 3: Monitor and Troubleshoot
- Run it in the background: Sysmon is lightweight tool so you can keep it open while working to monitor performance over time.
- Check regularly: If the user feel that their computer feels slow then they can open Sysmon to see what’s using the most resources.
- Update Sysmon: To get the latest features and bug fixes, update Sysmon with pip3 install sysmon --upgrade.
- Explore other tools: If you need more advanced monitoring, tools like htop or nmon can complement Sysmon.
How Does Sysmon Work
Here we discuss that how the sysmon work
1. Gathering Data from Your System
Sysmon is more like an investigator that they are always gathering data from your Linux computer. It communicates with the operating system (Linux) for real-time information regarding your CPU, GPU, memory, storage, and network. Here's how it performs that:
- CPU Utilization and Per-Core Clock Speed: Sysmon pulls information from Linux's /proc directory (a system folder that contains system information) to determine how hard your processor is working and how quickly each core is operating. It does this without bogging down your machine using Python libraries to retrieve this information.
- GPU Utilization and Clock Speed: If you are using a graphics card (such as NVIDIA or AMD), Sysmon uses drivers or utilities like nvidia-smi to check GPU usage. It verifies the level at which the graphics chip is being used and its speed, which is essential for video editing or gaming.
- Memory and Swap Utilization: Sysmon examines your swap space (a reserve area of memory on your storage) and your RAM to determine what percentage is being utilized. It takes this from system files such as /proc/meminfo to display whether or not your memory is low.
- Storage (HDD/SSD) Utilization: Sysmon monitors the amount that your hard drive or SSD is either reading or writing data. It employs Linux utilities such as psutil (a Python module) to scan disk usage to enable you to identify intense file activity.
- Network Utilization (Wi-Fi and Ethernet): Sysmon monitors what data is going through your Ethernet or Wi-Fi connection. Sysmon consumes system data from /sys/class/net to calculate network bandwidth and reports Wi-Fi link bandwidth to indicate signal strength.
2. Processing the Data with Python
Because Sysmon is coded in Python, it employs the use of this programming language to interpret all the data it gathers. Python is excellent at working with numbers and converting them into something useful. Sysmon takes the raw data (such as CPU usage percentages or network speeds) and structures it into forms that can be presented as graphs. It depends on Python libraries such as:
- psutil: Grabs system stats like CPU, memory, and disk usage.
- PyQt or Tkinter: Creates the graphical interface (the window with graphs you see).
- matplotlib or similar: Draws the colorful graphs for visualization.
3. Displaying Graphs in Real-Time
After Sysmon has the information, it uses Python to build realgraphs that refresh each second. For example:
- A line graph could illustrate your CPU usage peaking when you launch a large program.
- A bar graph might show memory usage, with a red warning if it's nearly full.
- An example graph could represent Wi-Fi bandwidth falling, signifying a poor signal.
Conclusion
Sysmon is a powerful yet user-friendly tool for keeping tabs on your Linux system’s performance. With its clear graphs and real-time updates, it’s perfect for anyone who wants to understand their computer better—whether you’re fixing a problem
