

The Vision API from Google Cloud has multiple functionalities. In this article, we will see how to access them. Before using the API, you need to open a Google Developer account, create a Virtual Machine instance and set up an API. For that, refer to this article.
We need to download the following packages -
pip install google.cloud.vision
The various services performed by Google Vision API are -
Facial Detection:
It can detect multiple faces in an image and express the emotional state of the faces.
Save the ‘credentials.json’ file in the same folder as the .py file with the Python code. We need to save the path of ‘credentials.json’ (C:\Users\…) as ‘GOOGLE_APPLICATION_CREDENTIALS’ which has been done in line-7 of the following code.
import os
import io
from google.cloud import vision
from matplotlib import pyplot as plt
from matplotlib import patches as pch

os.environ['GOOGLE_APPLICATION_CREDENTIALS'] =
      os.path.join(os.curdir, 'credentials.json')

client = vision.ImageAnnotatorClient()

f = 'image_filename.jpg'
with io.open(f, 'rb') as image:
    content = image.read()

image = vision.types.Image(content = content)
response = client.face_detection(image = image)
faces = response.face_annotations

possibility = ('UNKNOWN', 'VERY_UNLIKELY', 'UNLIKELY',
                  'POSSIBLE', 'LIKELY', 'VERY_LIKELY')

a = plt.imread(f)
fig, ax = plt.subplots(1)
ax.imshow(a)

for face in faces:
    print('Possibility of anger: {}'.format(possibility[face.anger_likelihood]))
    print('Possibility of joy: {}'.format(possibility[face.joy_likelihood]))
    print('Possibility of surprise: {}'.format(possibility[face.surprise_likelihood]))
    print('Possibility of sorrow: {}'.format(possibility[face.sorrow_likelihood]))

    vertices = ([(vertex.x, vertex.y)
                 for vertex in face.bounding_poly.vertices])

    print('Vertices covering face: {}\n\n'.format(vertices))

    rect = pch.Rectangle(vertices[0], (vertices[1][0] - vertices[0][0]),
                        (vertices[2][1] - vertices[0][1]), linewidth = 1,
                                       edgecolor ='r', facecolor ='none')
    ax.add_patch(rect)

print('Confidence in Detection: {}%'.format(
            face.detection_confidence * 100))

plt.show()
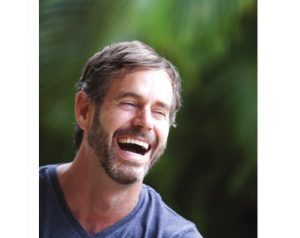
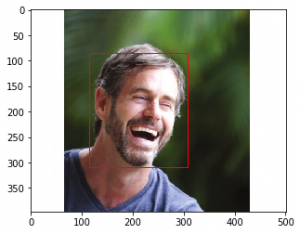
The above code detects multiple faces in a picture and determines the emotional expressions exhibited by the faces and whether any of the faces is wearing a headgear. It also returns the vertices which form a rectangle around the individual faces.
Lastly, it prints the percentage of surety with which the conclusions were drawn.
For example, when the following image is given as input -
Output:
Possibility of anger: VERY_UNLIKELY
Possibility of joy: VERY_LIKELY
Possibility of surprise: VERY_UNLIKELY
Possibility of sorrow: VERY_UNLIKELY
Vertices covering face: [(115, 84), (308, 84), (308, 309), (115, 309)]

Confidence in Detection: 99.93739128112793%
Logo Detection:
Detects popular product logos present in an image.
import os
import io
from google.cloud import vision
from matplotlib import pyplot as plt

os.environ['GOOGLE_APPLICATION_CREDENTIALS'] =
     os.path.join(os.curdir, 'credentials.json')

client = vision.ImageAnnotatorClient()

f = 'image_filename.jpg'
with io.open(f, 'rb') as image:
    content = image.read()

image = vision.types.Image(content = content)
response = client.logo_detection(image = image)
logos = response.logo_annotations

a = plt.imread(f)
plt.imshow(a)

for logo in logos:
    print(logo.description)
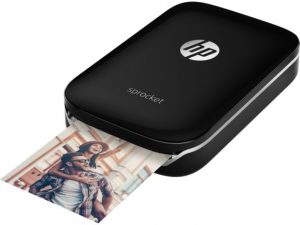
The above code detects the logos of various companies in an image and prints the name of the companies. For example, when given the following image:
Output:
hp
Label Detection:
Detects broad sets of categories in an image, which ranges from animals, trees to vehicles, buildings etc.
import os
import io
from google.cloud import vision
from matplotlib import pyplot as plt

os.environ['GOOGLE_APPLICATION_CREDENTIALS'] =
    os.path.join(os.curdir, 'credentials.json')

client = vision.ImageAnnotatorClient()

f = 'image_filename.jpg'
with io.open(f, 'rb') as image:
    content = image.read()

image = vision.types.Image(content = content)
response = client.label_detection(image = image)
labels = response.label_annotations

a = plt.imread(f)
plt.imshow(a)

for label in labels:
    print(label.description)
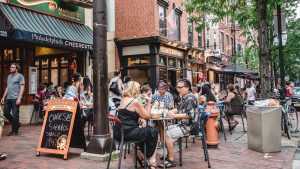
All possible labels or tags are attached to an image. For example, when the following image is given as input:
Output:
Street
Neighbourhood
Café
Coffeehouse
Sitting
Leisure
Tourism
Restaurant
Street performance
City
Landmark Detection:
Detects famous landmarks (mostly man-made) within an image.
import os
import io
from google.cloud import vision
from matplotlib import pyplot as plt

os.environ['GOOGLE_APPLICATION_CREDENTIALS'] =
    os.path.join(os.curdir, 'credentials.json')

client = vision.ImageAnnotatorClient()

f = 'image_filename.jpg'
with io.open(f, 'rb') as image:
    content = image.read()

image = vision.types.Image(content = content)
response = client.landmark_detection(image = image)
landmarks = response.landmark_annotations

a = plt.imread(f)
plt.imshow(a)

for landmark in landmarks:
    print(landmark.description)
    for location in landmark.locations:
        print('Latitude: {}, Longitude: {}'.format(
              location.lat_lng.latitude, location.lat_lng.longitude))
The above code recognizes any famous landmark and also returns the location of that landmark using latitudes and longitudes. For example, when we input the following picture:
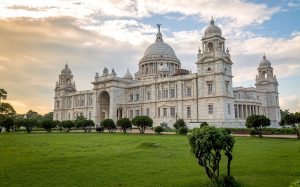
Output:
Victoria Memorial
Latitude: 22.545121, Longitude: 88.342781
For more information, visit the Google Vision API documentation here.
