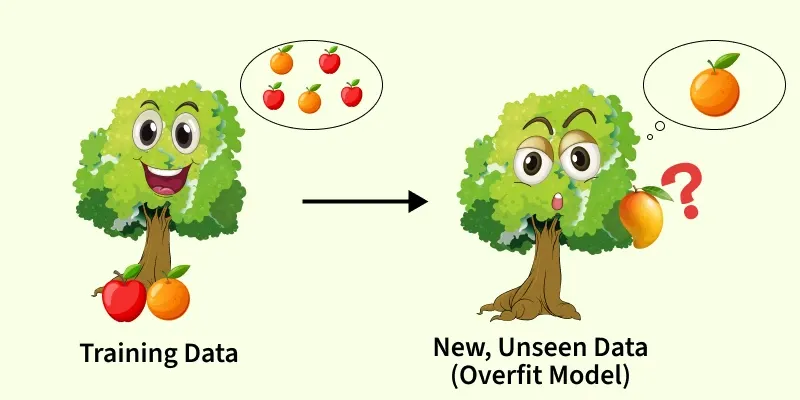
Decision Tree models are capable of learning very detailed decision rules but this often causes them to fit too closely to the training data. As a result, their accuracy drops significantly when evaluated on new, unseen samples.
Characteristics of an Overfitted Tree
Reasons for overfitting are:
- Complexity: Decision trees become overly complex, fitting training data perfectly but struggling to generalize to new data.
- Memorizing Noise: It can focus too much on specific data points or noise in the training data, hindering generalization.
- Overly Specific Rules: Might create rules that are too specific to the training data, leading to poor performance on new data.
- Feature Importance Bias: Certain features may be given too much importance by decision trees, even if they are irrelevant, contributing to overfitting.
- Sample Bias: If the training dataset is not representative, decision trees may overfit to the training data's idiosyncrasies, resulting in poor generalization.
- Lack of Early Stopping: Without proper stopping rules, decision trees may grow excessively, perfectly fitting the training data but failing to generalize well.
Strategies to Overcome Overfitting
Some of the strategies to prevent overfitting in decision trees are:
- Limit Tree Depth: Restricts how deep the tree can grow, preventing unnecessary branches.
- Minimum Samples per Split: Ensures splits occur only when enough samples are available.
- Minimum Samples per Leaf: Creates larger, more stable leaf nodes.
- Feature Selection: Removes irrelevant features that encourage noisy splits.
- Pruning: Reduces model complexity by trimming weak branches.
- Regularization: Introduces penalty controls to discourage complex structures.
- Cross-Validation: Helps detect unstable decisions across data folds.
Hyperparameters to Reduce Overfitting
Some of the hyperparameters used to minimize overfitting are:
- max_depth: Limits how deep the tree can grow.
- min_samples_split: Requires more samples before splitting.
- min_samples_leaf: Ensures leaves have enough data.
- max_leaf_nodes: Restricts total leaf node count.
- max_features: Reduces feature consideration per split.
Implementation of Pruning
Implementing pruning to handle overfitting in decision tree.
Step 1: Install Required Libraries
Installing Scikit-Learn and Matplotlib for model creation, dataset loading, splitting and plotting accuracies.
!pip install scikit-learn matplotlib
Step 2: Import Modules
Importing required modules.
- DecisionTreeClassifier: Build decision tree models
- train_test_split: Divide dataset
- load_breast_cancer: Built-in classification dataset
- matplotlib.pyplot: For visualization
from sklearn.tree import DecisionTreeClassifier
from sklearn.model_selection import train_test_split
from sklearn.datasets import load_breast_cancer
import matplotlib.pyplot as plt
Step 3: Load the Dataset
Loading the Breast Cancer dataset which contains useful numeric medical features.
data = load_breast_cancer()
X, y = data.data, data.target
Step 4: Split the Data
Splitting into training and testing for fair evaluation.
X_train, X_test, y_train, y_test = train_test_split(
    X, y, test_size=0.3, random_state=42
)
Step 5: Define Depth Range
Preparing different depths to observe how complexity affects overfitting.
depths = range(1, 20)
Step 6: Initialize Score Lists
Creating lists to store training and testing scores.
overfit_train_scores = []
overfit_test_scores = []
pruned_train_scores = []
pruned_test_scores = []
Step 7: Train Overfitted and Pruned Models
Looping through depths to generate accuracy trends.
- Overfitted model: unrestricted except depth
- Pruned model: restricted using min_samples_leaf
for depth in depths:

    overfit_model = DecisionTreeClassifier(max_depth=depth, random_state=42)
    overfit_model.fit(X_train, y_train)
    overfit_train_scores.append(overfit_model.score(X_train, y_train))
    overfit_test_scores.append(overfit_model.score(X_test, y_test))

    pruned_model = DecisionTreeClassifier(
        max_depth=depth,
        min_samples_leaf=4,
        random_state=42
    )
    pruned_model.fit(X_train, y_train)
    pruned_train_scores.append(pruned_model.score(X_train, y_train))
    pruned_test_scores.append(pruned_model.score(X_test, y_test))
Step 8: Visualize Accuracy Comparison
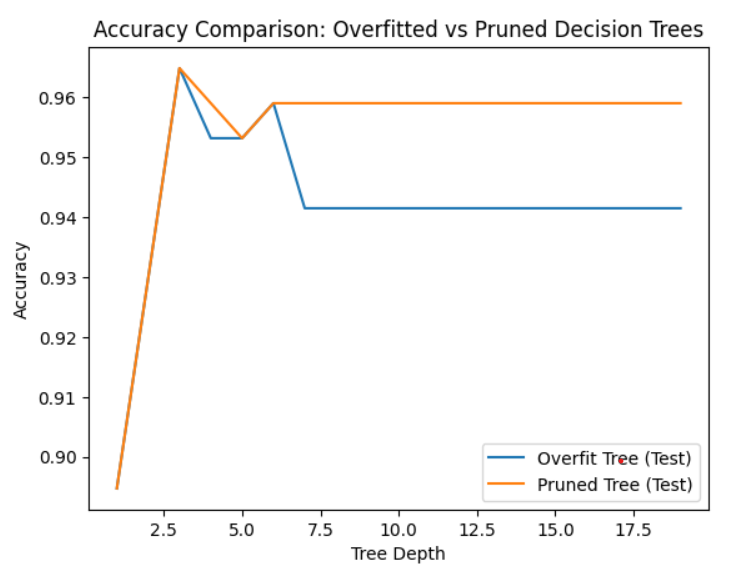
Plotting the test accuracy trends for both models.
plt.figure()
plt.plot(depths, overfit_test_scores, label="Overfit Tree (Test)")
plt.plot(depths, pruned_test_scores, label="Pruned Tree (Test)")
plt.xlabel("Tree Depth")
plt.ylabel("Accuracy")
plt.title("Accuracy Comparison: Overfitted vs Pruned Decision Trees")
plt.legend()
plt.show()
Output: