

Filters in Power BI allow users to refine large datasets by displaying only relevant information. They help simplify reports, improve clarity and make data analysis more effective across visuals, pages and reports.

Types of Power BI Filters
- Visual-level Filters: Apply only to a specific visual. They allow you to control the data shown in that particular chart or table without affecting others.
- Page-level Filters: Apply to all visuals on a single report page. Any filter applied here updates every visual on that page, ensuring consistent analysis.
- Report-level Filters: Apply across all pages in the report. These filters maintain uniform data conditions throughout the entire report.
- Drill-through Filters: Allow navigation to another page with filtered context. They help in analyzing detailed data related to a selected data point.
Filter Methods in Power BI
1. Basic Filtering
Basic filtering is the simplest and most intuitive filter mode. It provides a scrollable and searchable list of values for a specific field in our data. We can quickly search for a value and select it or use checkboxes to select multiple values.
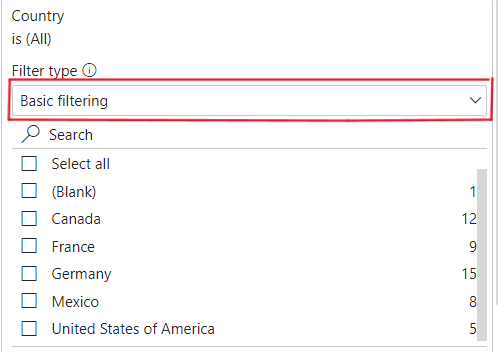
This mode is ideal for situations where we simply want to focus on one or more data points without needing to apply complex conditions. For example, we can filter by specific countries or product categories with ease.
2. Advanced Filtering
Advanced filtering gives us greater control over how data is filtered by allowing us to define more specific criteria. Instead of just selecting from a list, we can apply rules such as greater than, less than, between a range of values or even exclude certain values.
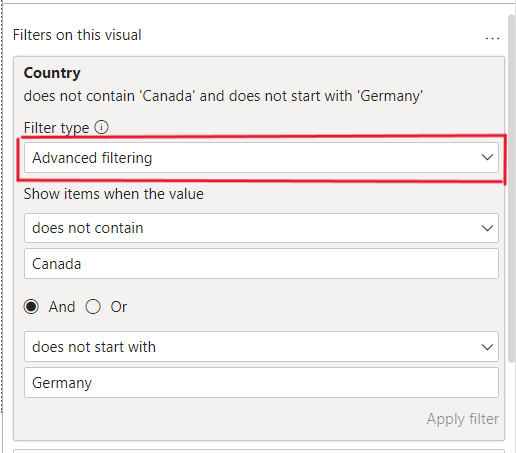
This mode is useful when we need to filter data based on numerical ranges or specific conditions. For example, we might want to exclude certain countries from the report or filter products with sales above a specific threshold.
3. Top-N Filtering
Top-N filtering is used when we want to focus on the highest or lowest N values in a dataset. This filter type allows us to quickly identify top performers or outliers. We can specify how many top or bottom items we want to display such as the top 5 countries by sales or the bottom 3 products by revenue.

Top-N filters are useful in identifying trends or analyzing the extremes within our data. For example, we might filter for the top 10 products in terms of sales or the lowest 5 regions in terms of performance.
Steps to Add Power BI Filter to a Visual
To apply a filter to a visual, select the required chart, table or other visual. The Filters pane will then show the Filters on this visual section.
Step 1: Add a Field to the Filter
Drag the required field from the Data/Fields pane to Filters on this visual. For example, add the Country field to filter the selected visual by country.

Step 2: Select Filter Values
Choose the required values from the field. For example, selecting Canada and France will display only the corresponding data in that visual.
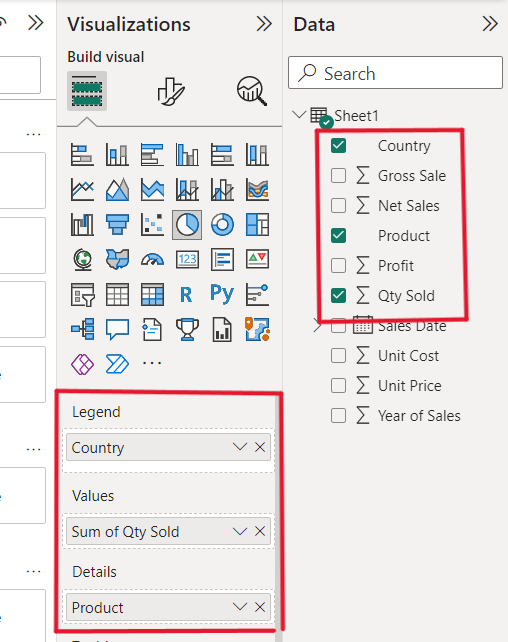

The visual updates automatically based on the selected filter values.
Steps to Add a Power BI Filter to a Page
Page-level filters use the same basic filtering process, but instead of applying the filter to one visual, they affect all visuals on the current page.
Step 1: Add a Field to the Page Filter
In the Filters pane, drag the required field to Filters on this page. For example, add the Product field.
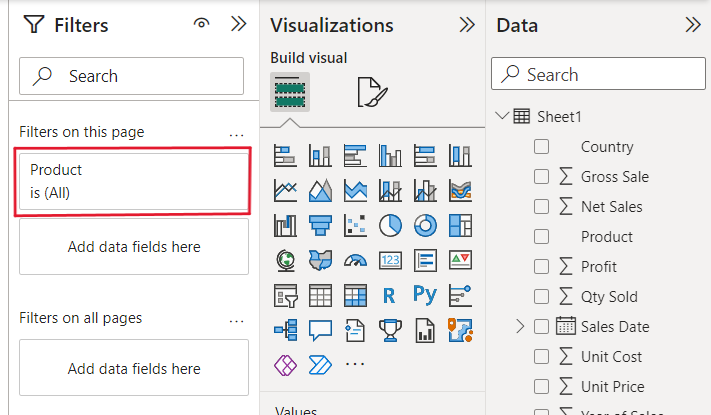
Step 2: Select Filter Values
Select the values you want to apply across the page, such as CPU, Hard Disk and Pad.

The selected values are applied to all visuals on the current page.

Note: Multiple visuals are useful for demonstrating that a page-level filter affects all visuals on the page.
Steps to Add Power BI Filter to Report
Report-level filters follow the same process as visual- and page-level filters, but they apply across all pages of the report.
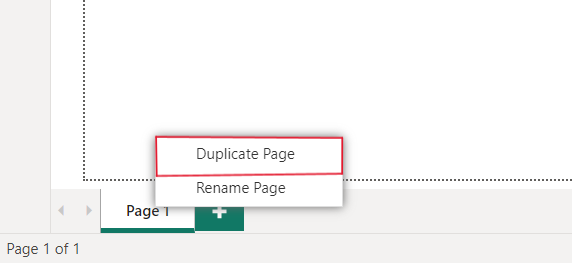
Step 1: Add Multiple Pages
Create or duplicate a page so that the report contains multiple pages. This makes it possible to observe the effect of a report-level filter across pages.
Step 2: Add a Report-Level Filter
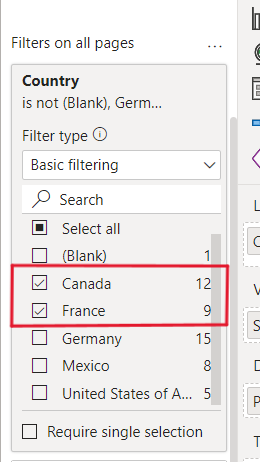
In the Filters pane, drag the required field to Filters on all pages. For example, add the Country field.

Step 3: Select Filter Values
Select the required values, such as Canada and France. The selected filter is then applied to the visuals across all pages of the report.
Note: Report-level filters are useful when the same filtering condition needs to remain consistent throughout the report.
Check Applied Filters in Power BI
In Power BI, we can easily find which fields and values are being filtered by checking the "Filters" panel. This panel shows the fields that have filters applied and we can hover over any filtered field to view the specific values that are included or excluded.

For example, if we’ve applied a filter to the Country field, we can see it listed in the Filters panel. By hovering over the filtered field, we'll see which specific values like Canada and France have been filtered. This helps us track what data is being displayed and ensures we’re analyzing the correct subset of data.
