

Working with numerical data in Power BI involves aggregating, calculating, analyzing and formatting values to generate meaningful insights. Power BI provides built-in aggregation functions, DAX calculations and visualization tools for working with numerical data.
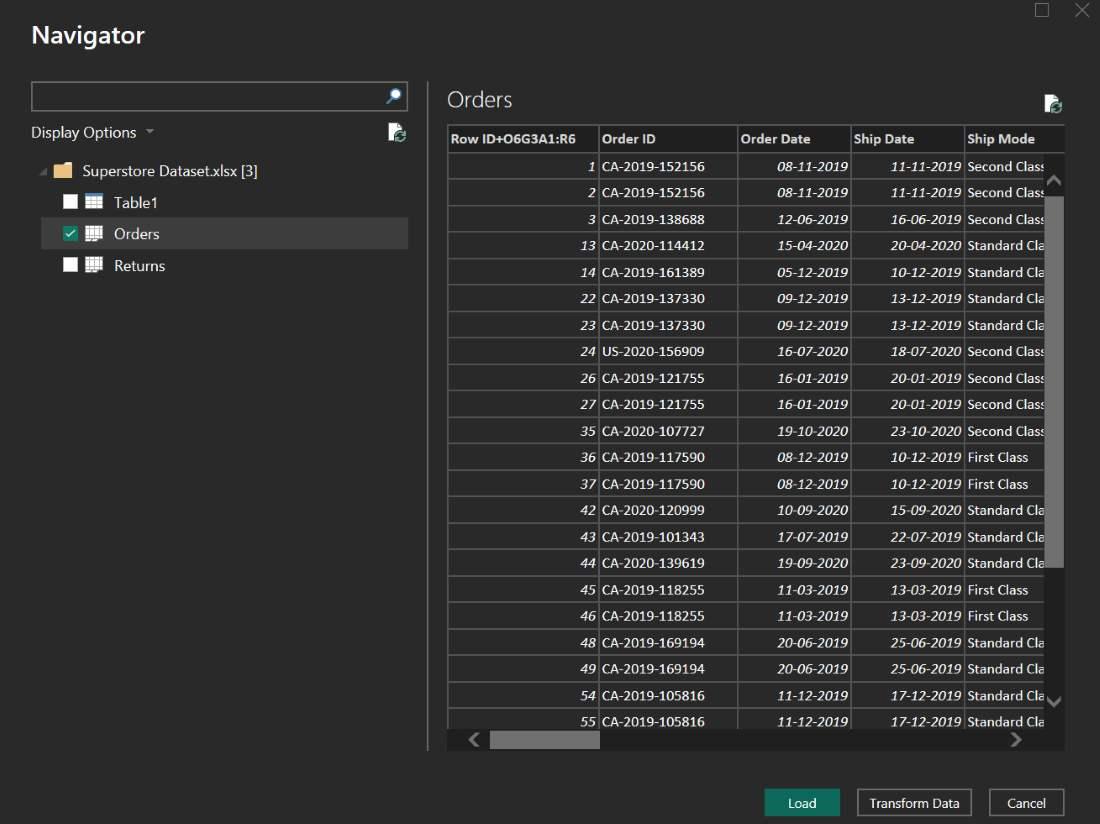
We are using Superstore dataset for this tutorial. To download it, click here.
The Superstore dataset containing numerical fields such as Sales, Quantity, Discount and Profit.
-(3).jpg)
- Once the data is imported, Power BI will automatically recognize numerical fields and format them accordingly. This data can then be used in visualizations, calculations and aggregations.
- For example, here’s the loaded Superstore dataset (13 columns):
Aggregating Numerical Data
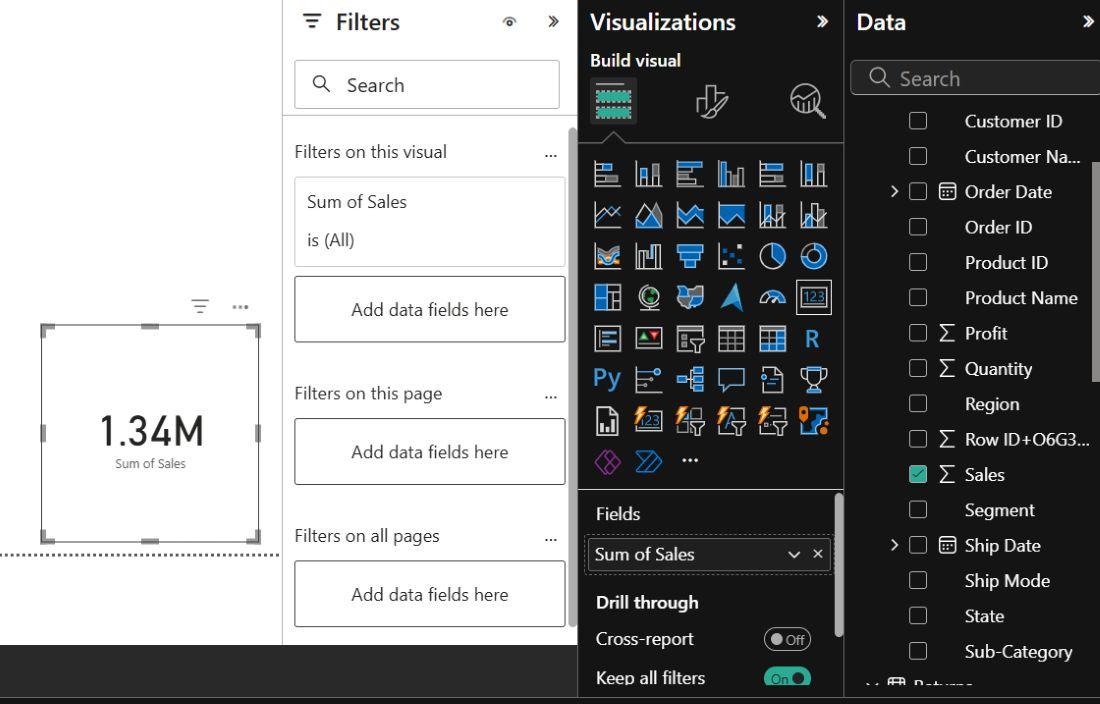
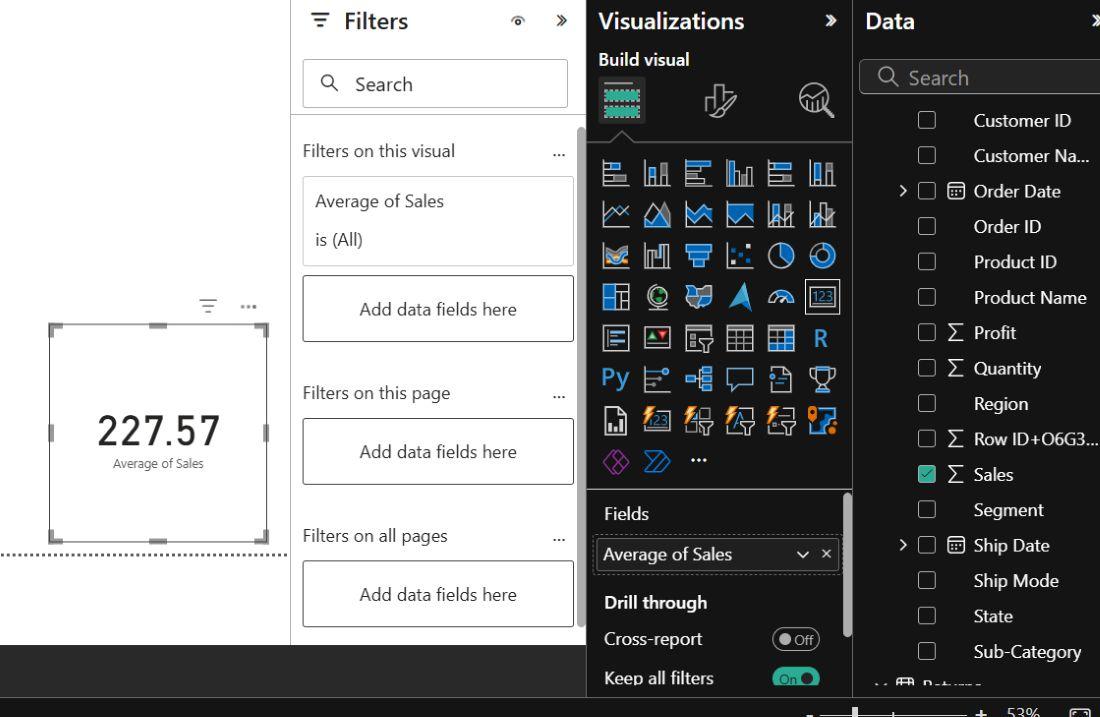
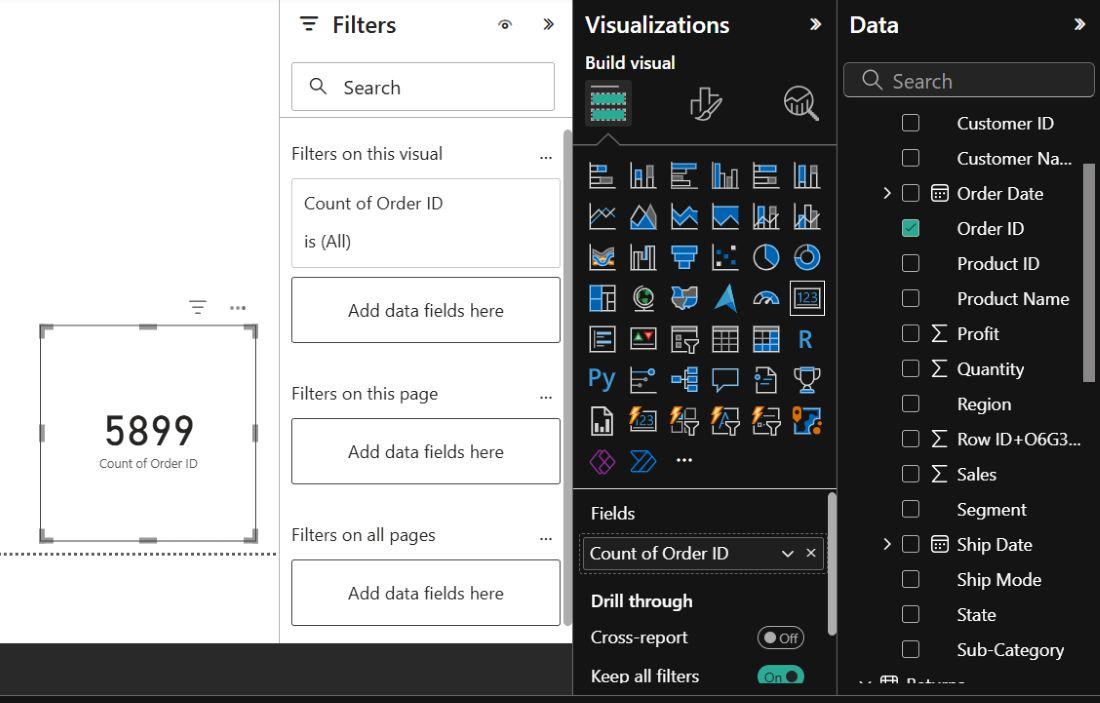
Aggregation summarizes numerical values to make large datasets easier to analyze. Power BI provides several built-in aggregation functions, including:
Sum: Adds all values in a column. It is commonly used for metrics such as total sales, revenue or quantity.
Average: Calculates the mean value of a column and helps identify the typical value in a dataset.
Count: Counts the number of non-blank values in a column.
Minimum and Maximum: Return the smallest and largest values in a column, respectively.
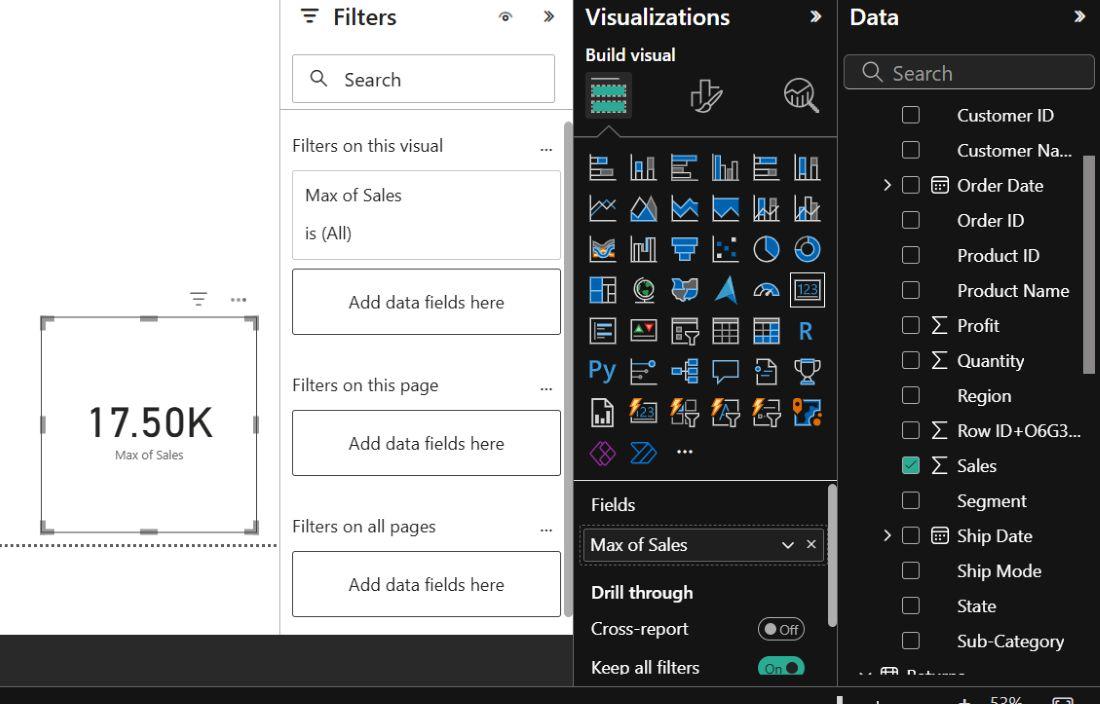
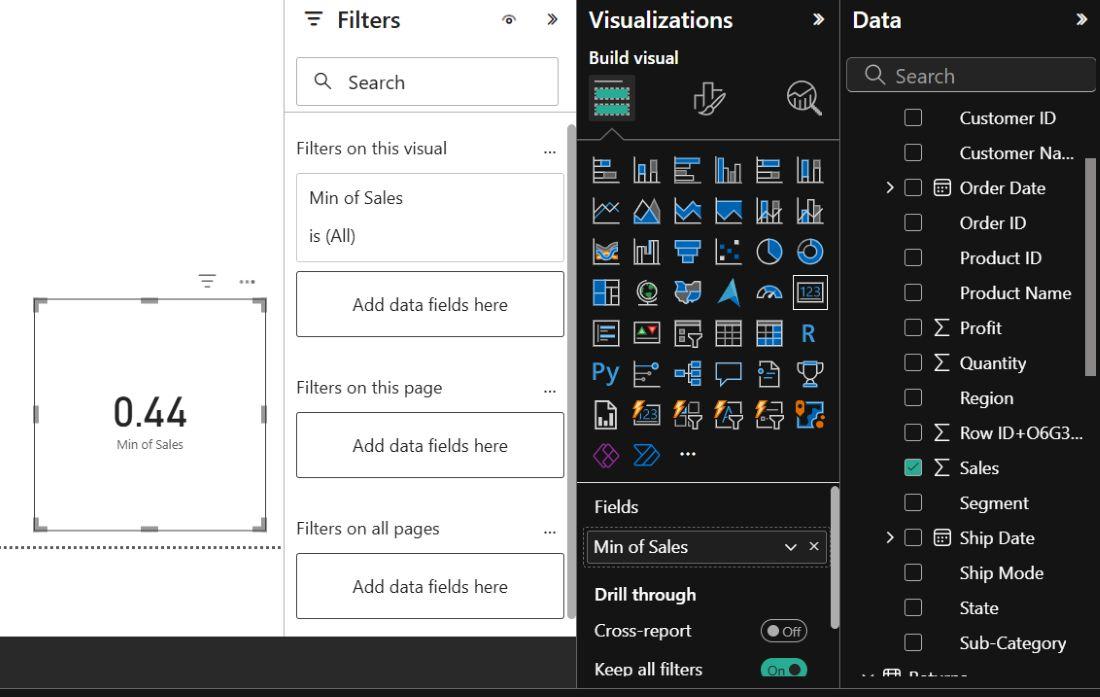
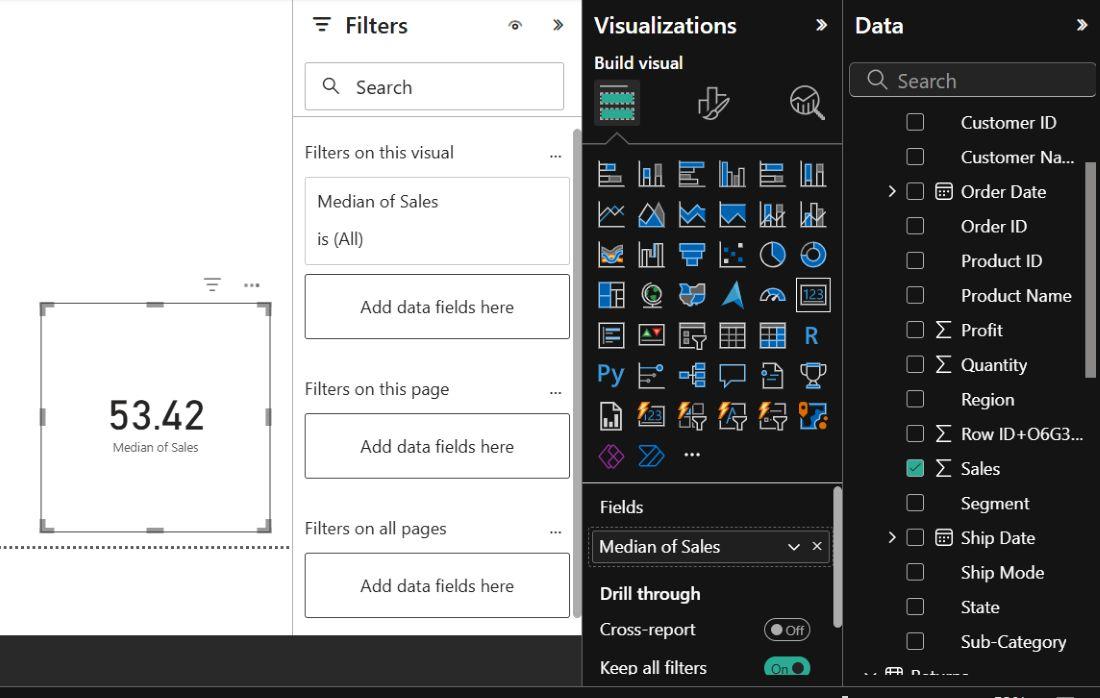
Median and Quartiles: The median identifies the middle value of a dataset, while quartiles divide the data into four parts and help analyze its distribution.
Creating Calculated Columns
- Calculated columns allow you to create new values from existing columns using DAX. They are useful when a row-level numerical calculation is required.
- For example, a Delivery Days column can be created by calculating the difference between the Ship Date and Order Date.

- It will take you to Power Query Editor.

- The calculated column is evaluated for each row and can then be used in tables, charts, filters and other visuals.

- Calculated columns are a crucial feature in Power BI for working with numbers. You can create new columns based on calculations using DAX (Data Analysis Expressions).

Visualizing Numerical Data
Numerical data becomes easier to understand when presented through appropriate visualizations. Power BI provides charts such as column, bar, line and scatter charts to compare values, identify trends and analyze relationships between numerical fields.
.jpg)
Formatting Numerical Data
Proper formatting makes numerical values easier to read and interpret in Power BI. Common formatting options include:
- Decimal Places: Controls the number of decimal places displayed.
- Thousand Separator: Improves readability of large numbers.
- Currency: Displays values with an appropriate currency symbol.
- Negative Values: Controls how negative numbers are displayed.
Custom Number Formats
Power BI supports custom formats that control how numerical values are displayed. Common format symbols include:
Symbol | Purpose |
|---|---|
0 | Displays a digit and shows zeros when required. |
# | Displays a digit when significant. |
, | Adds a thousand separator. |
% | Displays a value as a percentage. |
.00 | Displays two decimal places. |
For example, the format $#,##0.00 displays a number with a dollar sign, thousand separators and two decimal places.
