Gradient Boosted Trees for Classification - One of the Best Machine Learning Algorithms
A step by step guide to how Gradient Boosting works in classification trees
Machine Learning
Intro
Gradient Boosted Trees is one of my favorite algorithms, and it's been widely used by many Data Scientists. Whether you are building a model for your own project or trying to win a Kaggle competition, it is always worth considering Gradient Boosting.

In this story, I will take you through the details of how the algorithm actually works and provide Python code resources for you to use in your own projects.
Contents
The category of algorithms Gradient Boosted Trees belong to
Definitions and fundamentals
Example based explanation of Gradient Boosted Trees
Python code resources
What category of algorithms does Gradient Boosting belong to?
Gradient Boosting is a tree-based algorithm, which sits under the supervised branch of Machine Learning. Note that it can be used for both classification and regression problems. In this story, however, I will focus on the classification side.
Side note, I have put Neural Networks in a category of their own due to their unique approach to Machine Learning. However, they can be used to solve a wide range of problems, including but not limited to classification and regression. The below chart is interactive so make sure to click👇 on different categories to enlarge and reveal more.
If you enjoy Data Science and Machine Learning, please subscribe to get an email whenever I publish a new story.
Definitions and Fundamentals
To understand how Gradient Boosted Trees are formed, we need to familiarize ourselves with logistic regression and decision tree concepts.
Regression Trees - this may sound strange at first, but the Gradient Boost Classification algorithm does not use Classification Trees. Instead, it uses Regression Trees. This is because the target in Gradient Boosted Trees is the residual, not the class label. Don't worry if you are confused about this. It will become clearer once we start going through the example.
Residual - it is the difference between the observed value and the estimated value (prediction). We will use residuals for calculating MSE and for tree predictions.
MSE (Mean Squared Error) - there are multiple ways to find the best split in the tree node, with MSE being one of the most common approaches used for regression trees. Hence, MSE is what we will use in our algorithm. Note, 'Observed' and 'Predicted' are the actual and model-predicted values for each data record.
Residual = (Observed - Predicted).

Odds Ratio - it is simply a ratio between the number of events and non-events. Say, if your data contains 3 spam emails and 2 non-spam emails, the odds would be 3:2 (1.5 in decimal notation).
Log(odds) - is a natural logarithm of the odds ratio. So if,
the odds are 3:2 = 1.5, then log(odds) = log(1.5) = 0.405...Probability vs. odds - it is easy to convert odds to probabilities and vice versa. For example if,
the odds are 3:2, then the probability is 3/5 = 0.6.You can use the following equations to convert between probability and odds:

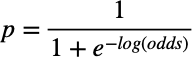
The probability expressed through log(odds) - is the final piece that we will need for our model calculations:
Note, if you want to get a deeper understanding of the above concepts, you can refer to my story about Logistic Regression:
Logistic Regression in Python— A Helpful Guide to How It Works
Gradient Boosted Trees - example-based explanation
First, let me share with you a process map to help you see how each step fits together to produce a Gradient Boosted Trees model.
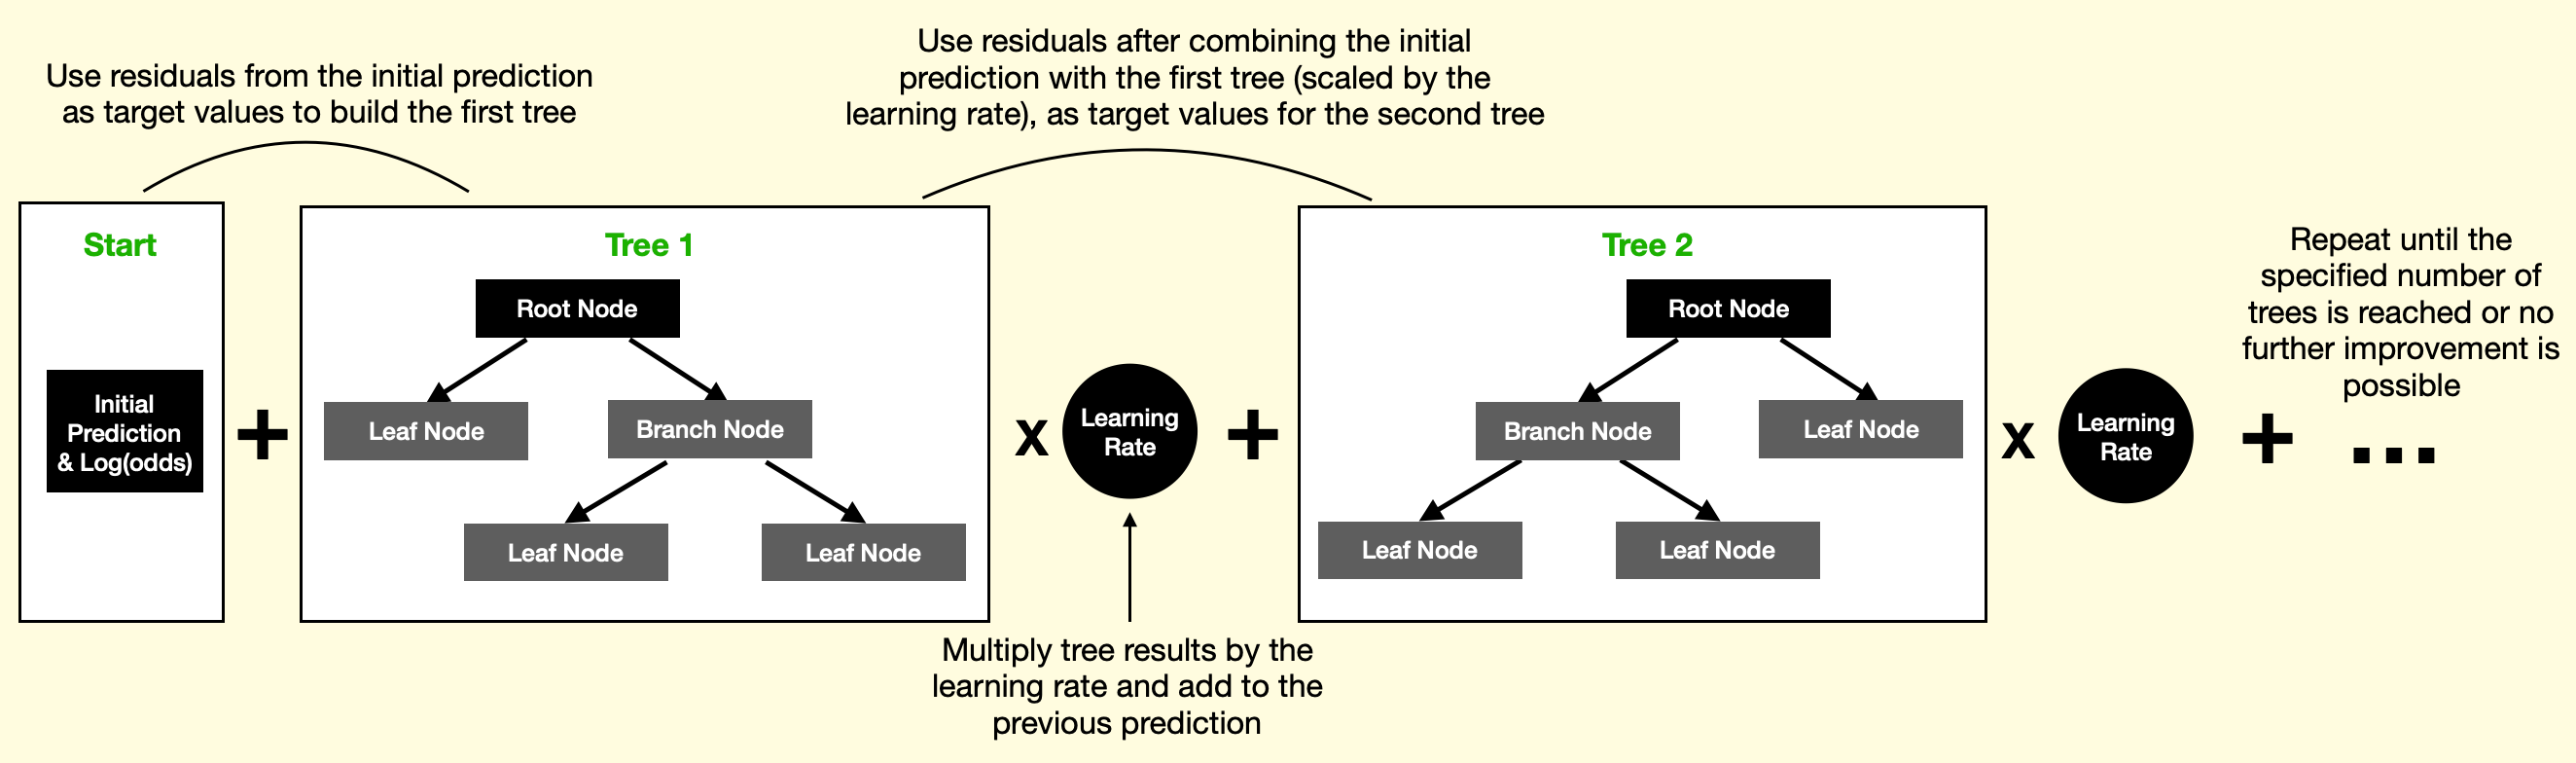
Start
First, let's take a look at the data we will use.
We have 9 observations from the Australian weather dataset with 'Wind Gust Speed' and 'Humidity at 3 pm' as our two model features (independent variables). 'Rain Tomorrow Flag' is what we want to predict with our model.
Note, we are using a tiny set of data because we want to make the explanation easier. However, the algorithm works the same with a much larger dataset.
Our data contains 5 observations where Rain Tomorrow = 1 and 4 observations where Rain Tomorrow = 0.
The initial prediction is simply a probability derived from all observations Probability = 5 / 9 = 0.56. Meanwhile, residuals are calculated for each observation separately and, in this case, take one of the two values: Residual = Observed - Predicted = 1 - 0.56 = 0.44 or 0 - 0.56 = -0.56.
Since we are building a classification model, we will also need to calculate log(odds). While the initial prediction is Probability = 0.56 the log(odds) value of the initial leaf is: Log(odds) = log(5/4) = log(1.25) = 0.22. Note that log(odds) from the initial leaf will be used to recalculate residuals after building Tree 1.
Tree 1
Let's now build the first tree. Below are the model hyperparameters that we use for this specific example. I just want to highlight a few of them at this stage, but I will provide the complete Python code in the Python section at the end of this story.
While the tree's default size has a max depth of 3, we have set it to 1 to make the example simpler. This means that the trees we are building will be decision stumps. In total, our model will contain 3 decision stumps with the learning set to 0.5.
It is important to reiterate that with Gradient Boosting, we are not predicting class labels (rain / no rain) but residuals instead (see below table).
Let's look a the first decision tree (stump) and work out how it's been created.
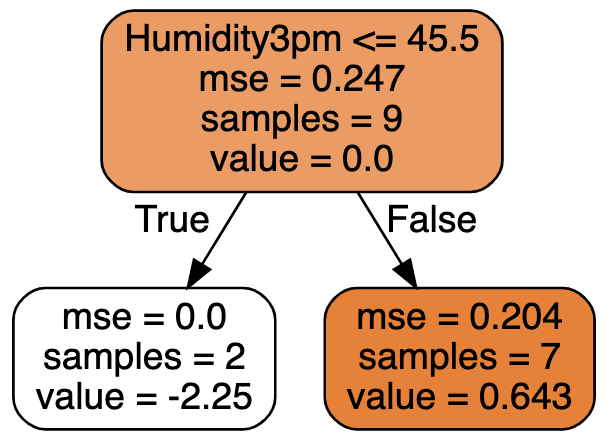
The first question to answer is: "Why has the algorithm selected this particular node split (Humidity at 3 pm ≤ 45.5)?"
The best split is identified by calculating MSE for every possible split using 'Humidity at 3 pm' and calculating MSE for every possible split using 'Wind Gust Speed.'
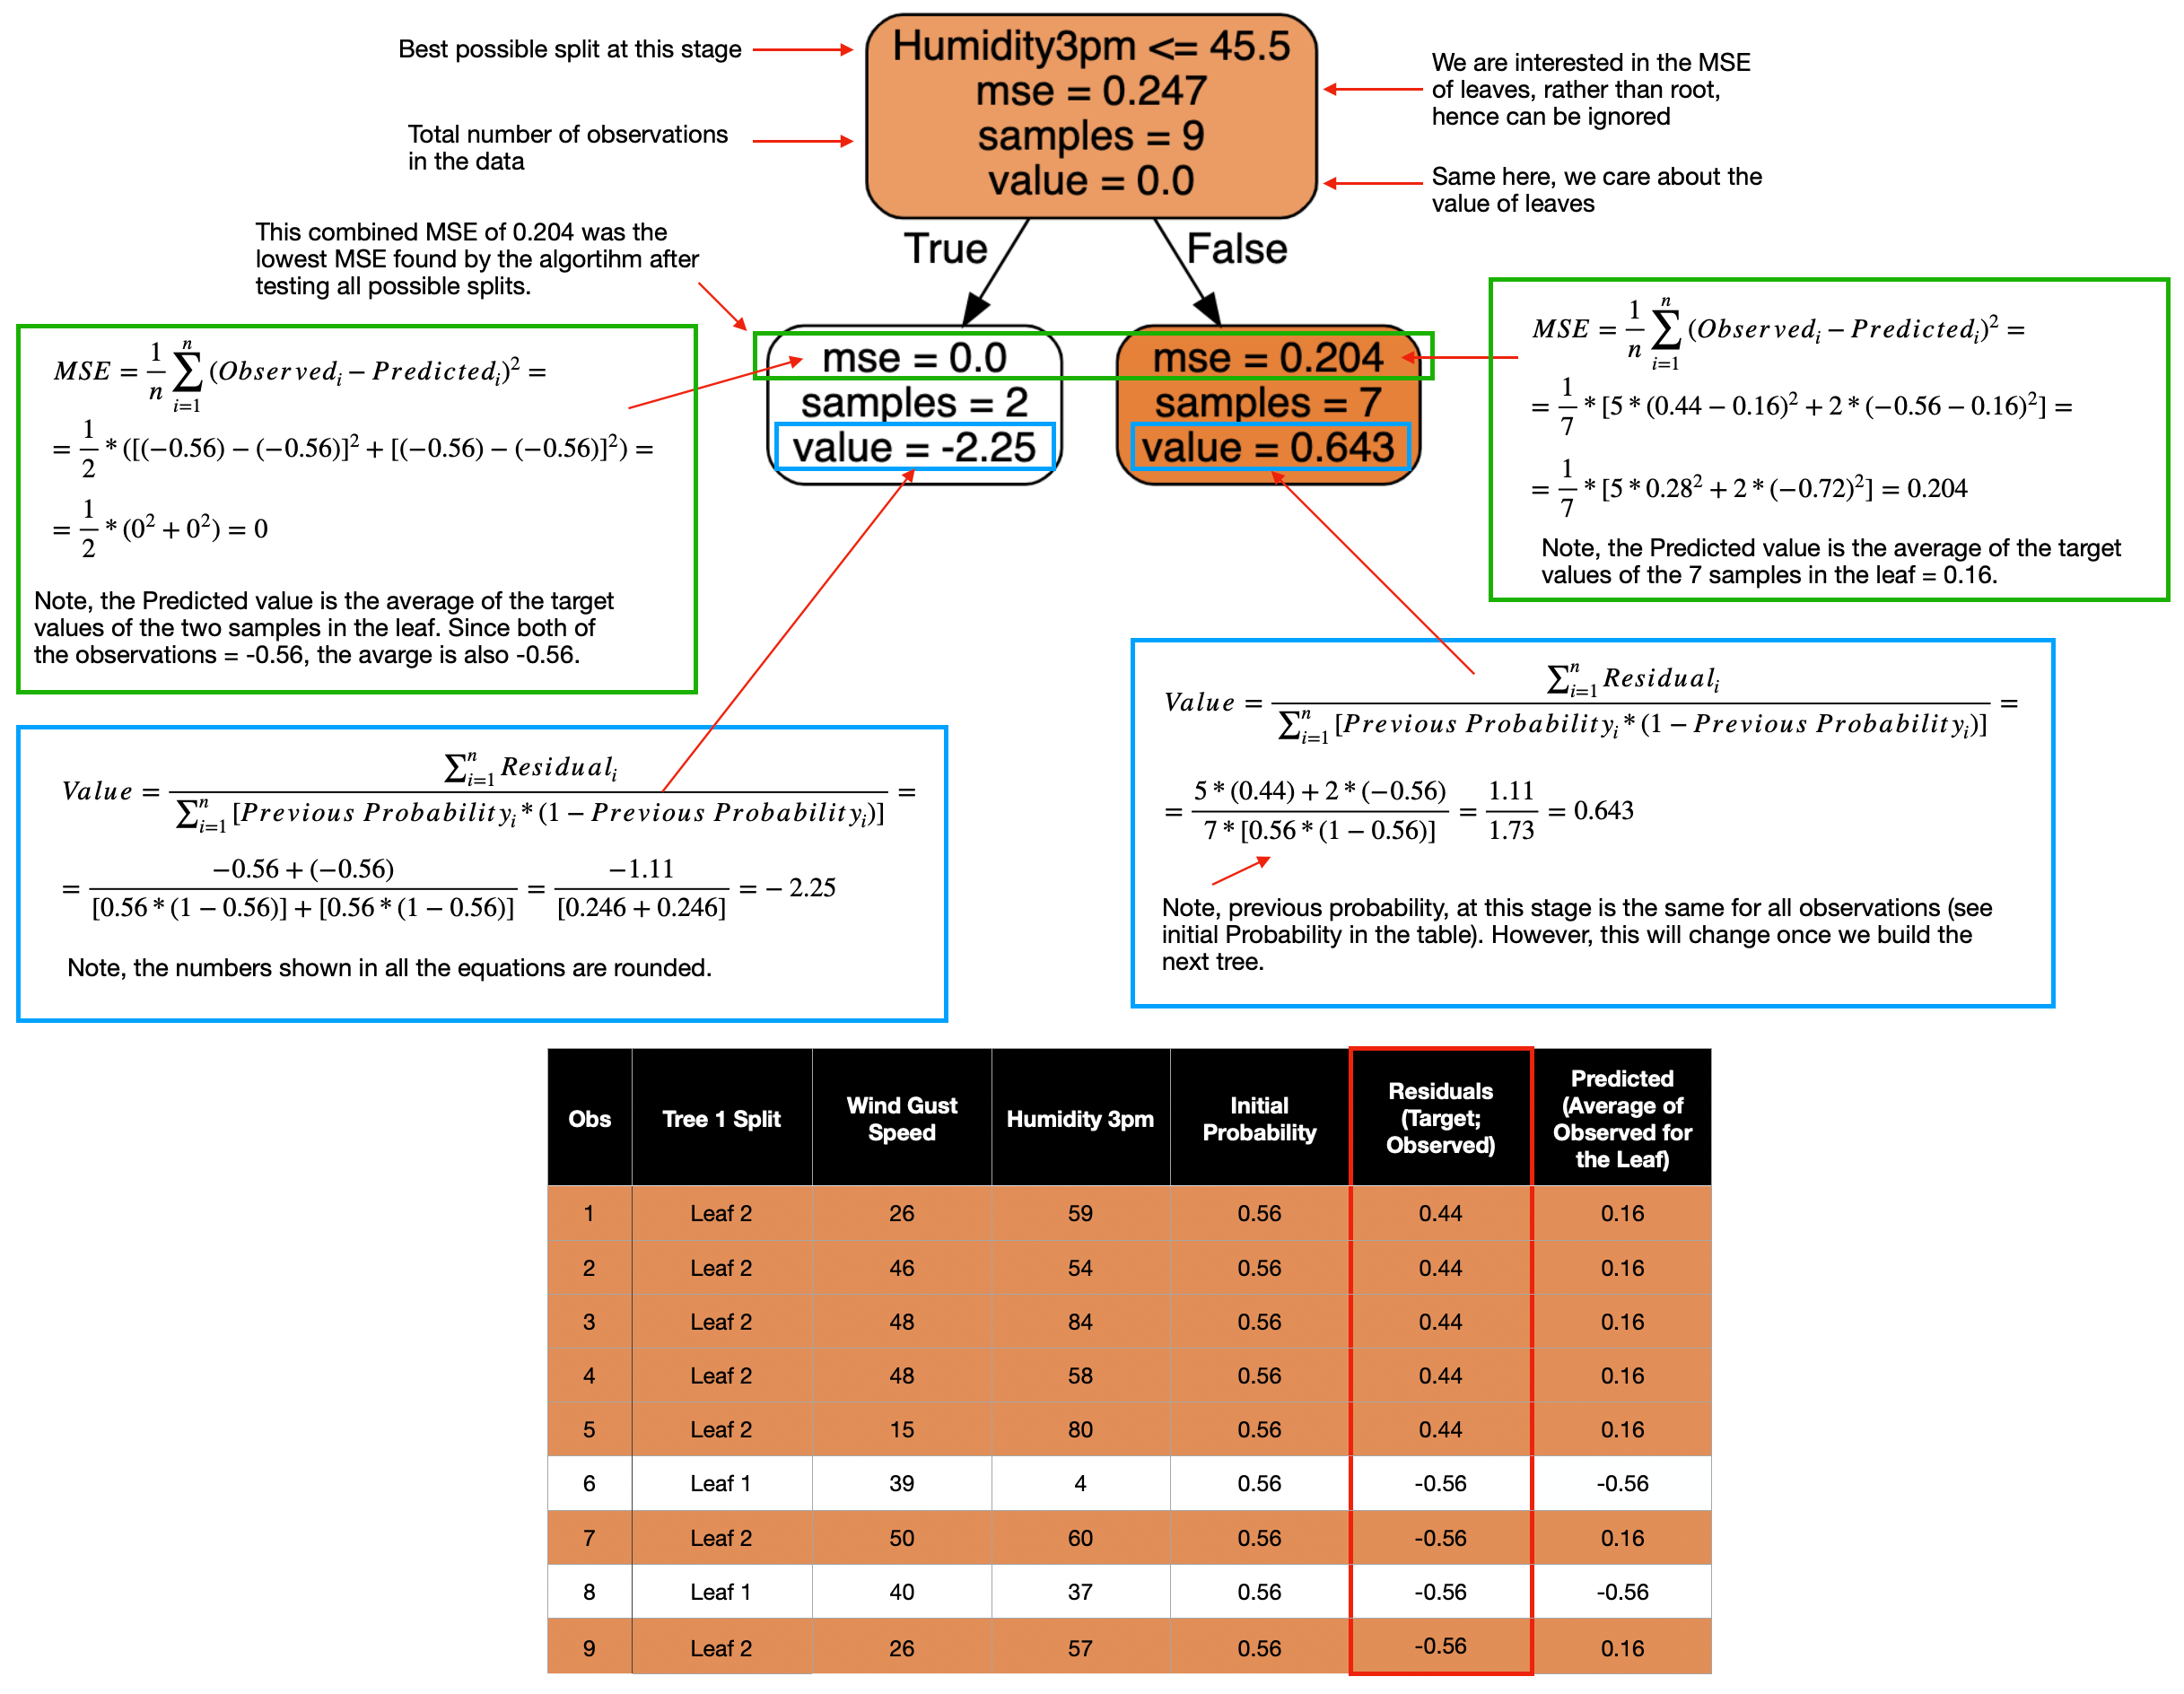
Then the algorithm compares all of those splits and picks the one with the lowest MSE. You can see the calculation of MSE for the chosen split below.
The second question we need to answer: " What is the purpose of 'value' within the tree, and how is it calculated?"
The leaf 'value' is what the algorithm uses to recalculate the residuals, which are then used as a target when building the next tree.
'Value' is calculated with the below formula:

Now let's put all of this knowledge to practice and calculate each of the metrics within the tree:
The last part left to do before moving to Tree 2 is recalculating the residuals (model targets). Following the steps in the process map above, this is what we need to do to recalculate the residuals for each observation:
Note, the calculation above gives us the new log(odds). However, to get new residuals, we first need to convert log(odds) back to probabilities using this formula:
Finally, we calculate new residuals using the class label and the new predicted probability.
Here is a table containing recalculated values for all observations:
One interesting observation is that the new predictions for Obs7 and Obs9 are actually worse than before. This is exactly why we need to build many trees, as having a larger number of trees will lead to improvements in predictions across all observations. You can see this illustrated in the gif image at the beginning of this story.
Tree 2
Now we can use new residuals to build the second tree. Note, I will not list all of the formulas again since those are the same as in Tree 1. However, if you want to attempt calculations yourself, remember to use the new values from a table created post Tree 1.
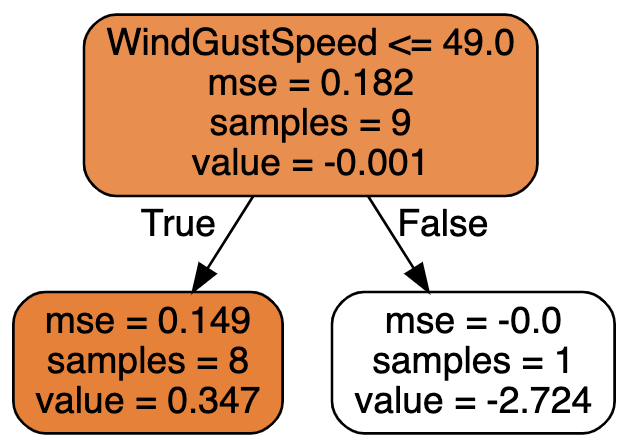
The algorithm identified Wind Gust Speed ≤49 as the best node split in the second tree with 8 observations (samples) in leaf 1 and only 1 observation in leaf 2.
Note, when building a larger tree from a big dataset, it is advisable to restrict the minimum number of observations allowed in a leaf to reduce the chance of overfitting.
Since we already know how the leaf values are calculated, let's go straight into finding the new residuals.
Then we calculate new residuals and place them in the table below to be used for a target in Tree number 3:
Tree 3...
The same process is repeated when building additional trees until the specified number of trees is reached, or the improvement becomes too small (falls below a certain threshold). For interest, this is what stump number 3 looks like:
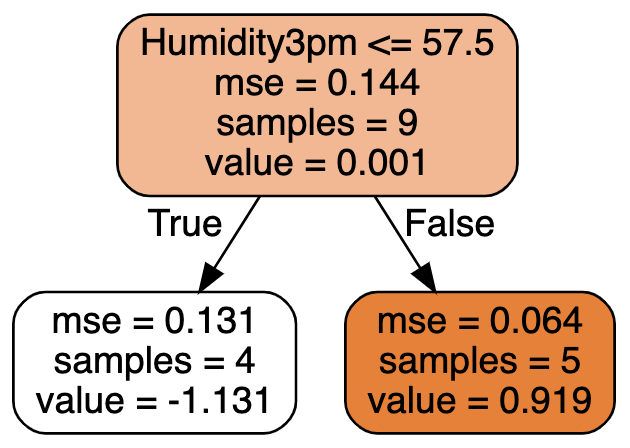
Since we restricted our model to only 3 trees, the last part left is to get the final set of predictions by following the above methodology to combine the log(odds). I believe you have got the hang of it by now, so I will not repeat it. Instead, let's jump into the Python code.

Python code resources
Now that you understand how Gradient Boosted Trees work let's build a model using the full set of observations but with the same two features as before. This is so we can generate the below 3D graph to demonstrate model predictions.
Setup
We will use the following data and libraries:
Scikit-learn library for splitting the data into train-test samples, building Gradient Boost Classification model and model evaluation
Plotly for data visualizations
Let's import all the libraries:
Then we get the Australian weather data from Kaggle, which you can download following this link: https://www.kaggle.com/jsphyg/weather-dataset-rattle-package.
We ingest the data and derive a few new variables for usage in the model.

Model training
Next, we define a function to be used for model training and run the model to produce the results:
Step 1— split data into train and test samples
Step 2— set model parameters and train (fit) the model
Step 3— predict class labels on train and test data using our model
Step 4— generate model summary statistics
Step 5— run the model and display the results
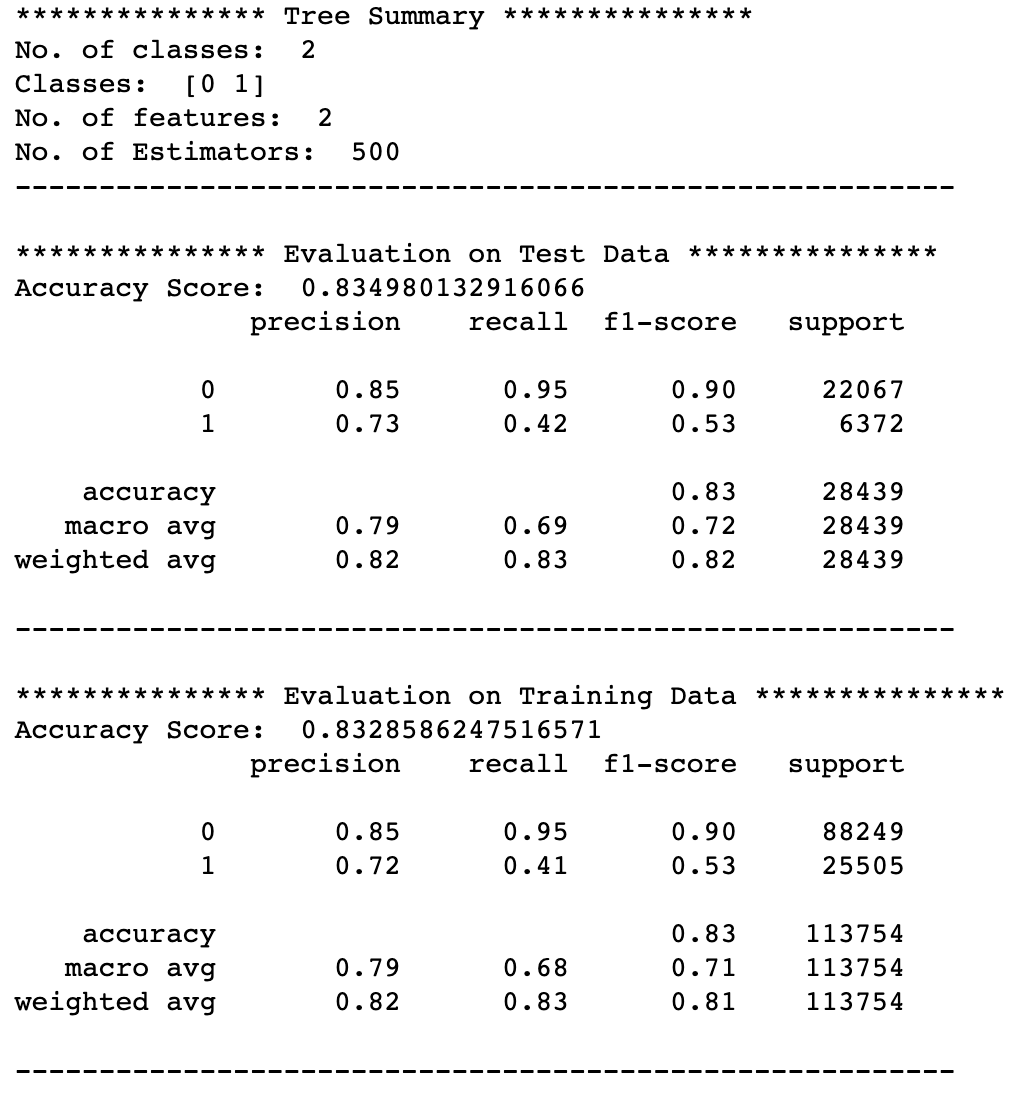
These are the model evaluation metrics the above function returns.
Finally, you can use the below function to generate the 3D graph shown above.
Conclusion
Although this story is quite long and with many details, the Gradient Boost algorithm is one of the most important ones to understand for a Data Scientist. I sincerely hope you had fun reading it and that there is no more mystery left behind this algorithm for you.
Cheers! 👏 Saul Dobilas
Also, here are some resources on alternative algorithms if you found this article interesting.
AdaBoost Machine Learning Algorithm: How to Improve Performance of Hard to Predict Cases
Naive Bayes Classifier - How to Successfully Use It in Python?