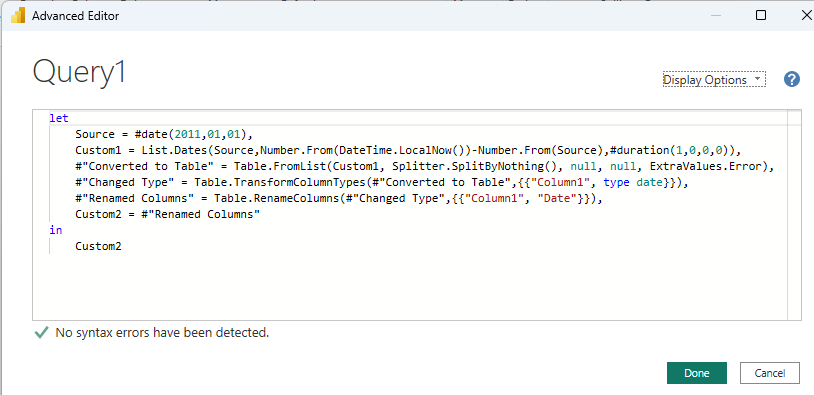
Data modeling in Power BI organizes data into a structured model by:
- Organizing tables and columns
- Defining relationships between tables
- Setting cardinality and cross-filter direction
- Supporting accurate calculations and reporting
Power BI Interface & Data Loading
1. Power BI Desktop
Power BI Desktop is the development environment used to connect to data, transform it, create data models and build interactive reports. It provides Report, Data and Model views for working with data and relationships.
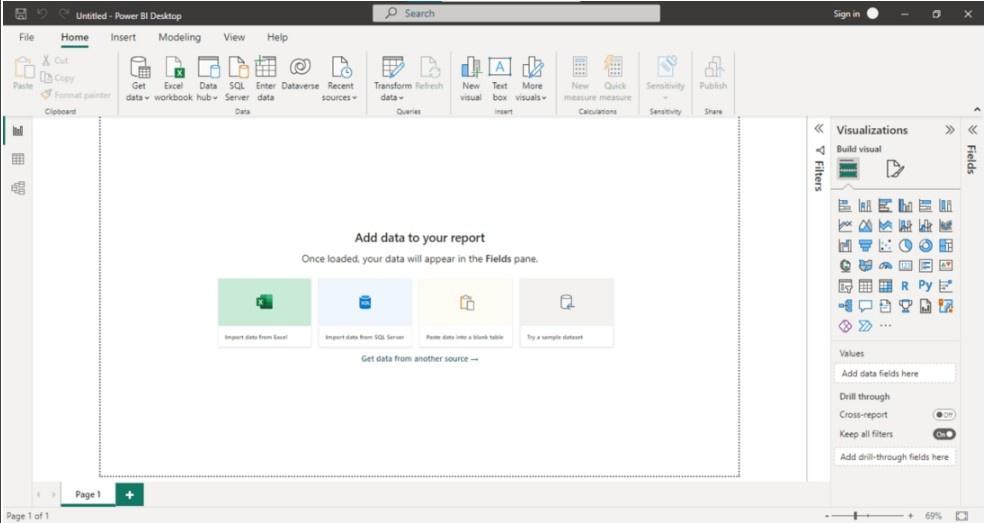
2. Power BI Desktop Panes
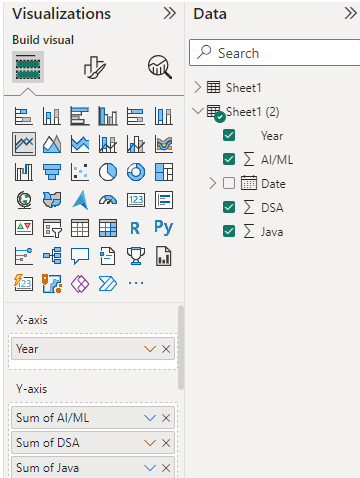
Power BI Desktop provides Report, Data and Model views for working with reports, data and relationships. The interface also includes panes such as Data and Visualizations for selecting fields and configuring visuals.
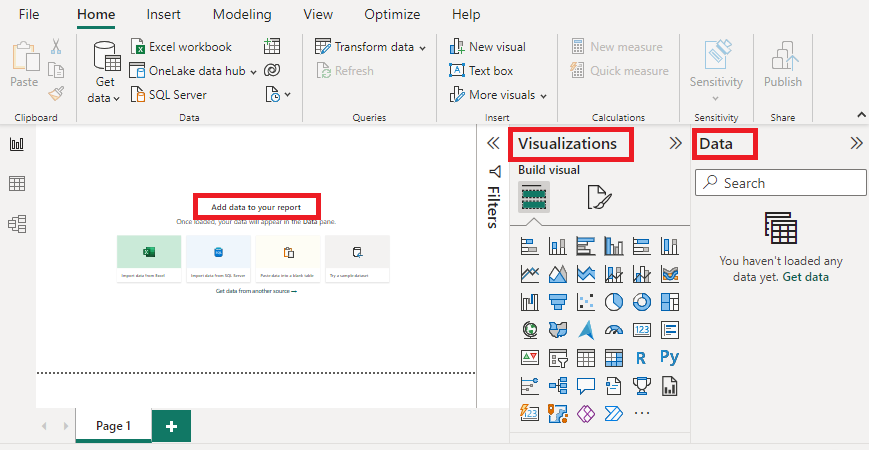
3. Data Pane Overview
The Data pane displays the tables and fields available in the model, which can be used to build visuals and perform analysis.
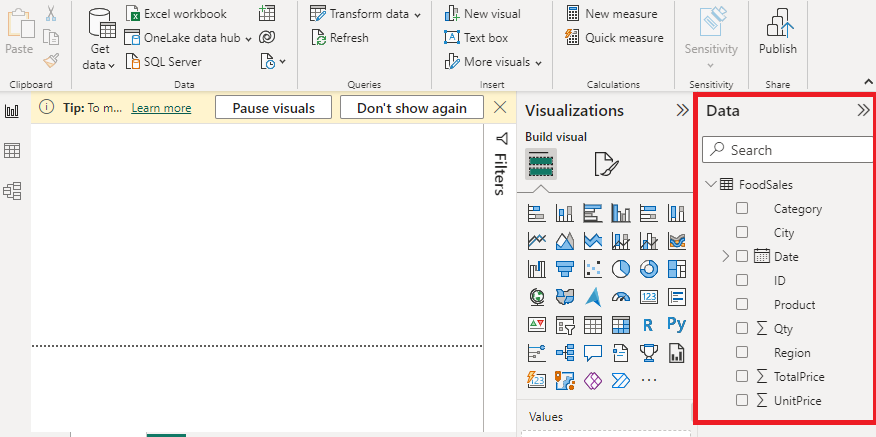
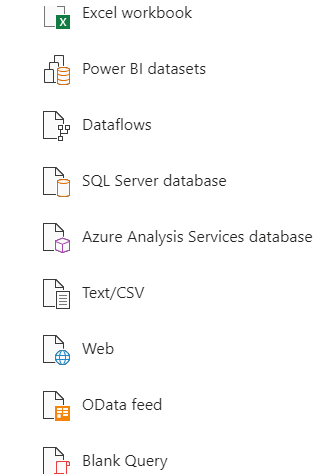
4. Connecting to Data Sources
Power BI can combine data from multiple sources into a single data model for analysis.
5. Data Loading & Transformation
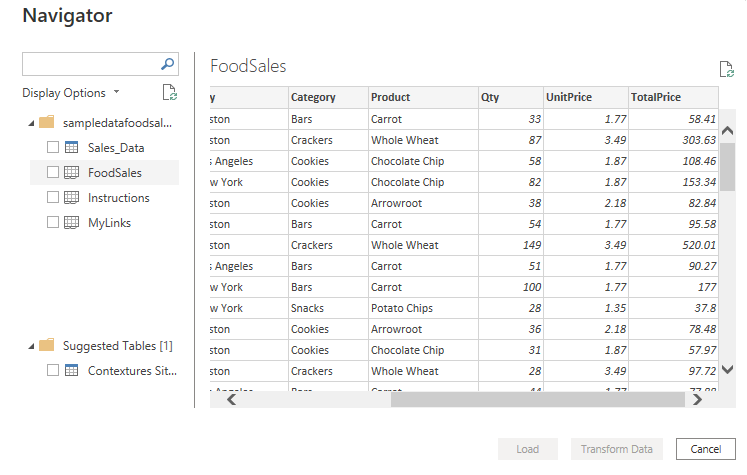
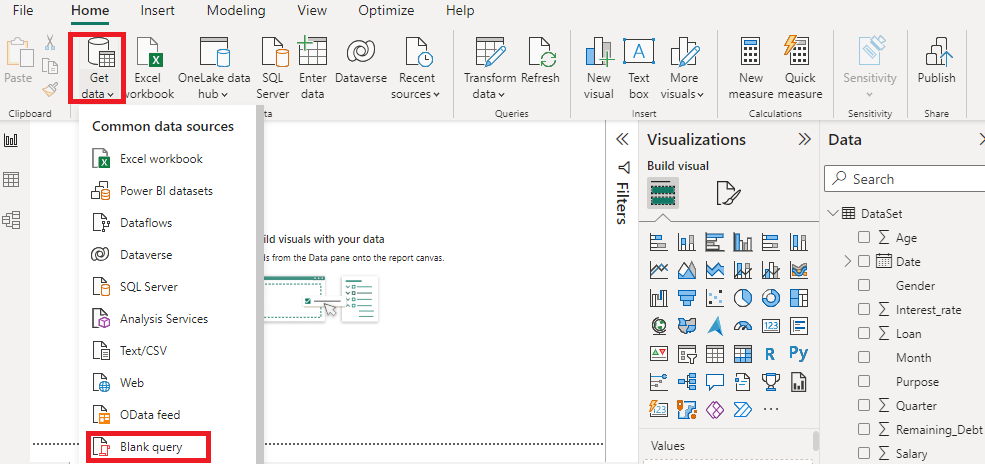
After selecting a data source, the Navigator displays the available tables and objects. Users can select the required data and load it directly or open it in Power Query for transformation before loading it into the model.
Relationships in Data Modeling
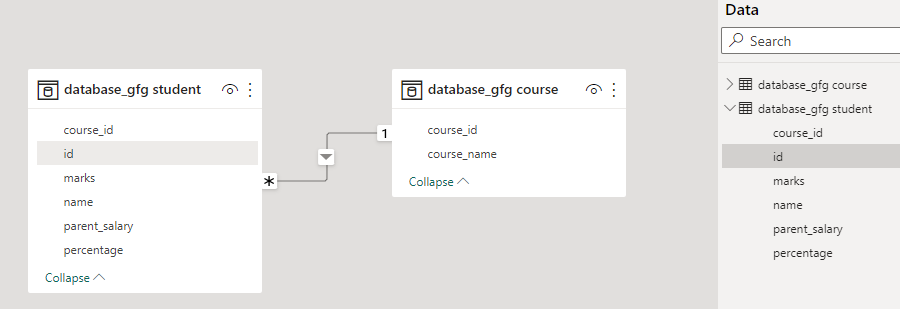
Relationships connect tables in a Power BI data model through related columns, such as a key column in one table and the corresponding column in another. Relationships determine how filters and calculations propagate between tables.
Views in Power BI
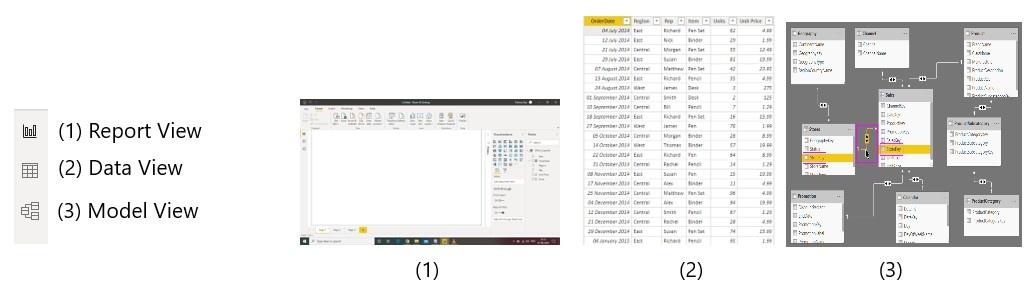
Power BI Desktop provides three main views for working with data and reports:
- Report View: Used to create and interact with report visuals.
- Data View: Used to view and inspect the data stored in tables.
- Model View: Used to view, create and manage relationships between tables.
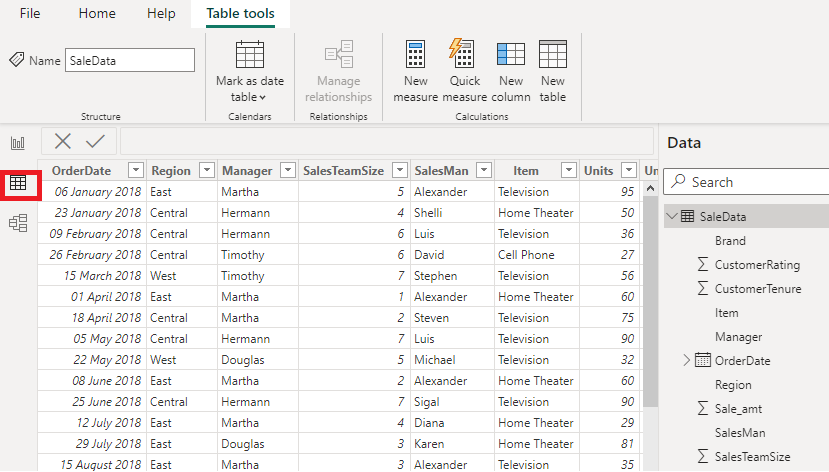
Data view in Power BI
Data view displays the data stored in the tables of the Power BI model. It allows users to inspect columns and rows and verify the data before creating relationships and calculations.
Defining relationships between related columns allows Power BI to connect information across tables and apply filters correctly during analysis.
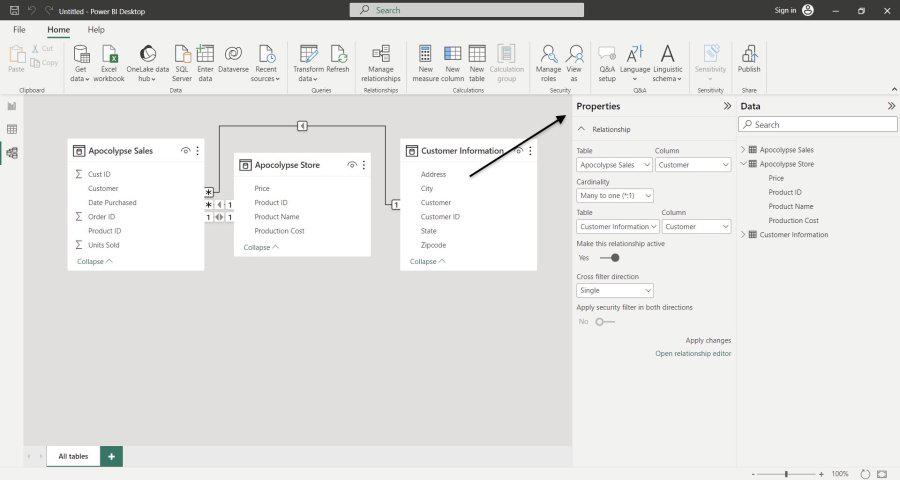
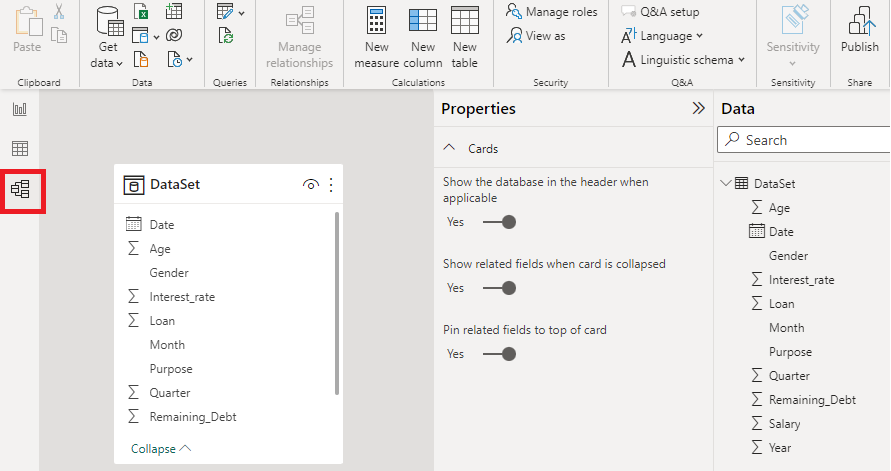
Model View in Power BI
Model view provides a visual representation of the tables, columns and relationships in the data model. It is used to create, inspect and manage relationships between tables.
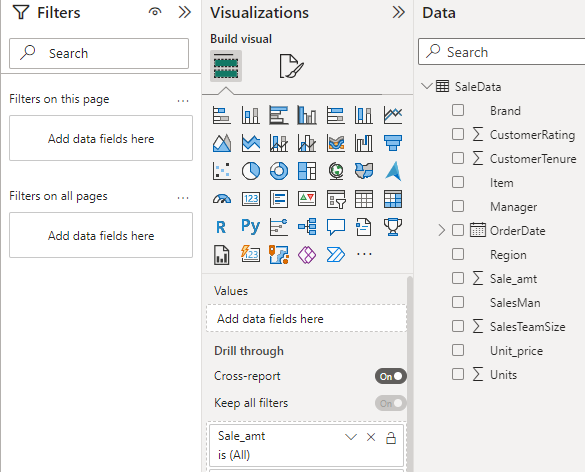
Report View in Power BI
Report view is used to create and interact with report visuals using the tables and fields in the data model. Users can select multiple parameters for analysis based on requirements, enabling customized and interactive data exploration.
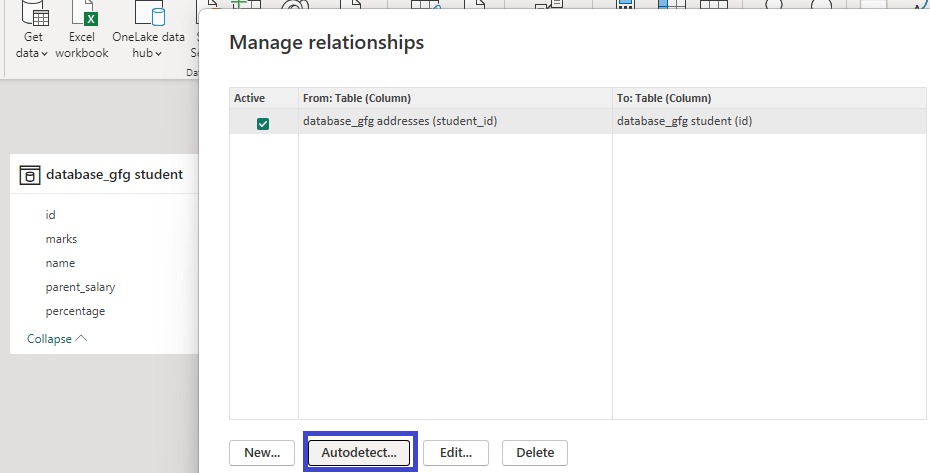
- Creating and Managing Relationships: Power BI can automatically detect relationships between tables. Users can also create or edit relationships manually in Model view when required.
Create relationships in Power BI
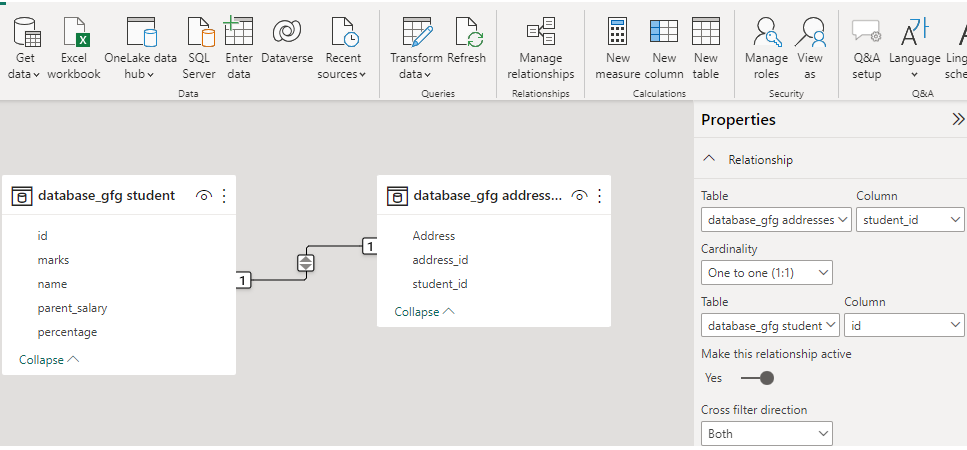
Managing and editing table relationships refers to the process of defining and maintaining the connections between tables in a relational database. Table relationships are important for maintaining data integrity and ensuring efficient data retrieval. The below image shows a example showing the editing of relationship between tables and its support for cardinality.
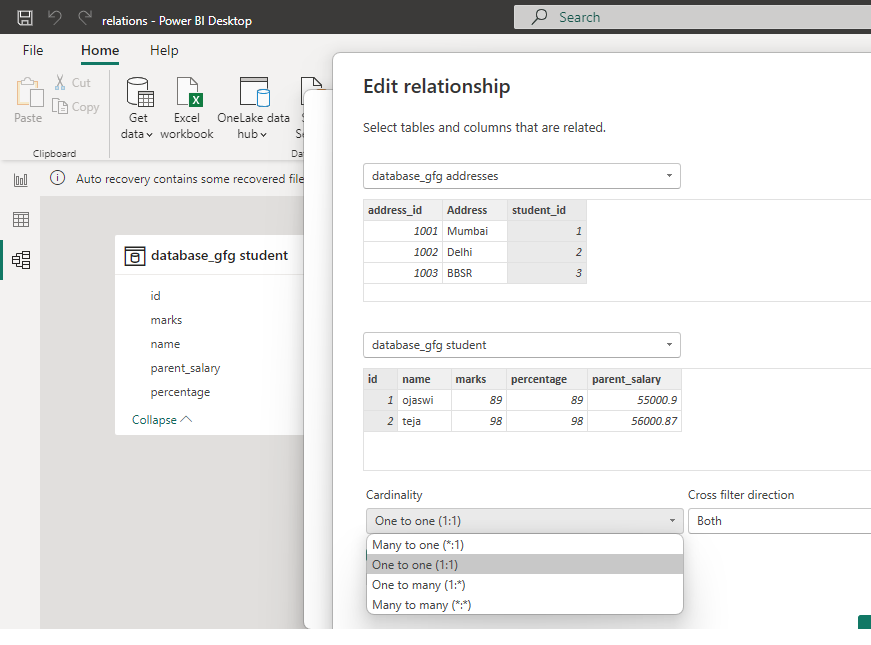
1. Many to one: Multiple rows in one table can match a single row in the other table based on the related column.
2.One to one: Each value in the related column of one table corresponds to at most one value in the related column of the other table.
3. One to many: Just reverse of many to one.
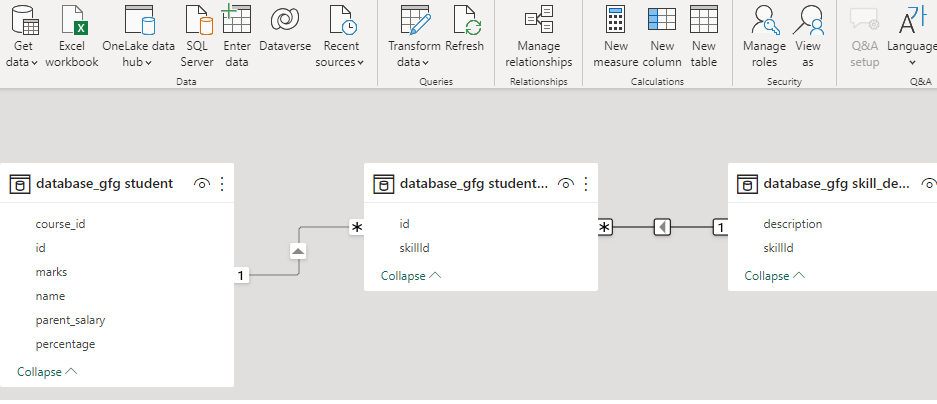
4. Many to many: Multiple rows in one table can relate to multiple rows in another table. This occurs when the related column can contain duplicate values on both sides.
| Cardinality | Meaning |
|---|---|
| One-to-many | One row in one table can relate to multiple rows in another table. |
| Many-to-one | Multiple rows in one table relate to one row in another table. |
| One-to-one | Each row in one table relates to at most one row in another table. |
| Many-to-many | Multiple rows on each side can relate to multiple rows on the other side. |
Example:
Customers
| CustomerID | CustomerName |
|---|---|
| 1 | A |
| 2 | B |
Sales
| CustomerID | Sales |
|---|---|
| 1 | 500 |
| 1 | 700 |
The CustomerID column in Customers contains unique values, while CustomerID in Sales can contain repeated values. Therefore, the relationship is one-to-many from Customers to Sales.
Cross filter direction: Cross-filter direction determines how filters propagate between related tables. Power BI supports single and both-direction filtering, depending on the relationship and model design.
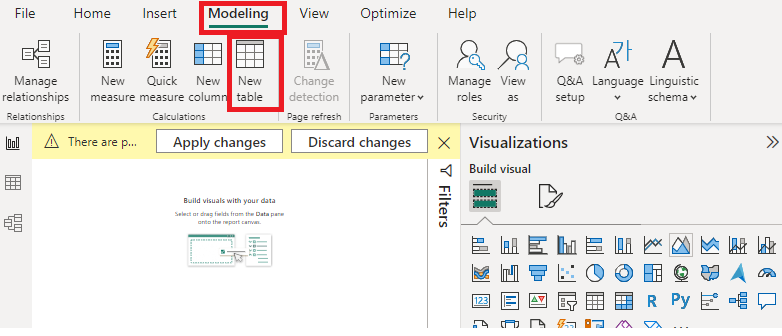
DAX: DAX (Data Analysis Expressions) is a formula language used to create measures, calculated columns and calculated tables in Power BI's tabular data models.
Power Query Editor
Power Query Editor is used to connect to, clean and transform data before it is loaded into the Power BI model.