

An Interaction Overview Diagram (IOD) is a UML diagram that provides a high-level view of interactions and control flow within a system. It shows how components or objects communicate and collaborate to achieve a specific goal.
- Provides a high-level overview of system interactions without focusing on detailed message exchanges.
- Helps in requirements analysis, system design, documentation, and stakeholder communication.
Example: In an online shopping system, an IOD can show the overall flow from user login, product selection, and payment processing to order confirmation.
Notations for Interaction Overview Diagram
Annotations and explanations from the Interaction Overview UML diagrams feature several fundamental components that help to show control flow and system interactions.
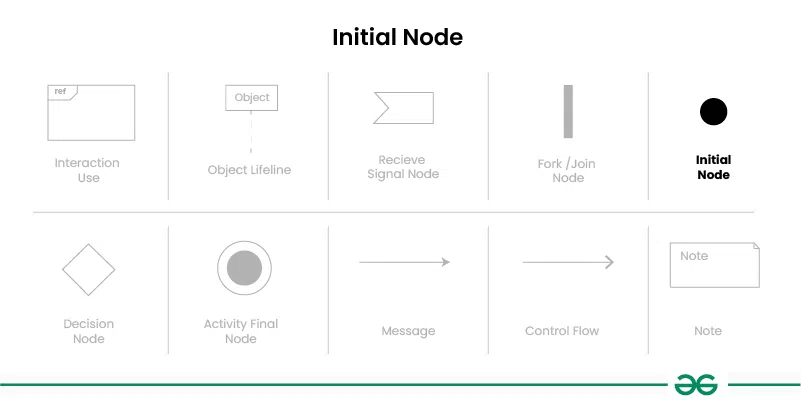
1. Initial Node
Represents the starting point of an interaction in the diagram.
- Shown as a small solid black circle.
- Has one outgoing control flow arrow to the next activity.
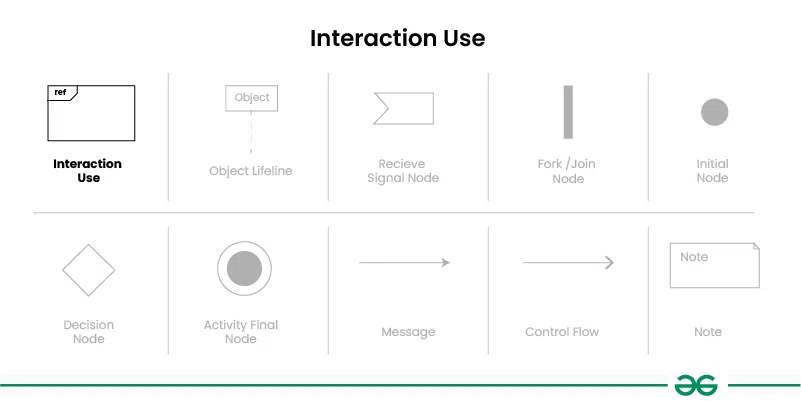
2. Interaction Use
Represents a reference to another interaction defined elsewhere in the system.
- Shown as a rectangular box containing the interaction name.
- Helps reuse existing interactions and reduce diagram complexity.
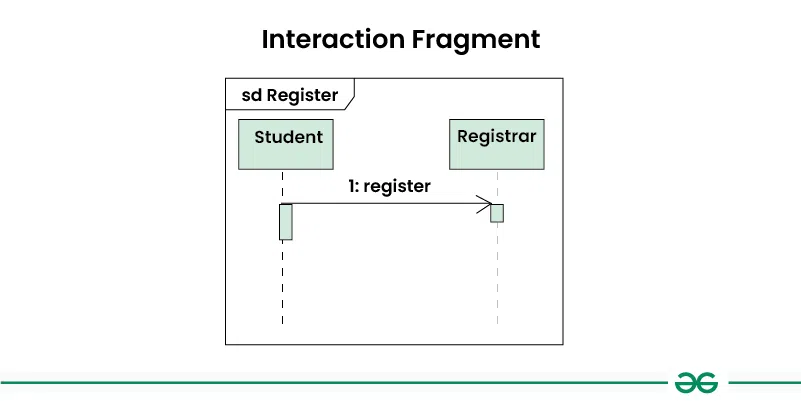
3. Interaction Fragment
Used to group and organize related interactions within the diagram.
- Helps structure complex interactions into manageable sections.
- Improves readability and understanding of the interaction flow.
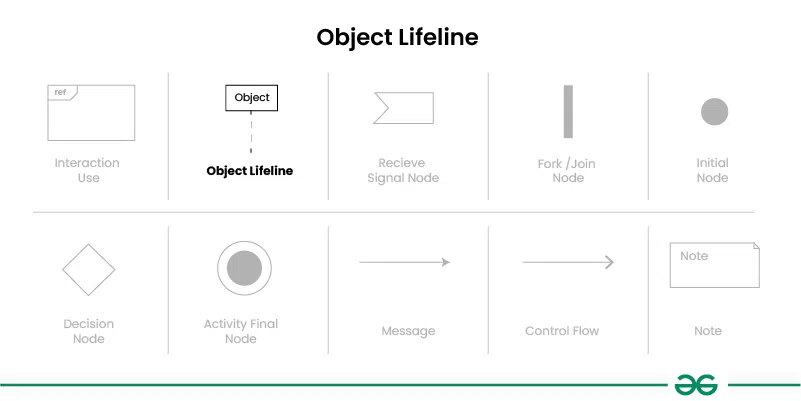
4. Object Lifeline
Represents the lifespan of an object during an interaction.
- Shown as a vertical dashed line with the object name at the top.
- Indicates the existence of an object throughout the interaction.
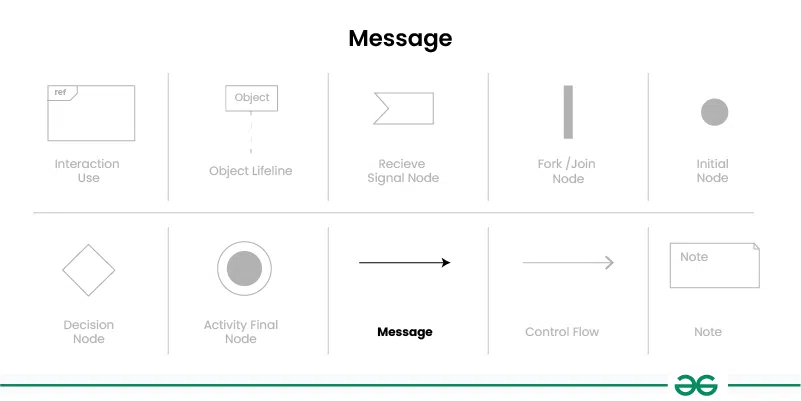
5. Message
Represents communication between objects or components in the system.
- Shown as an arrow between lifelines.
- Indicates the direction of information or control flow.
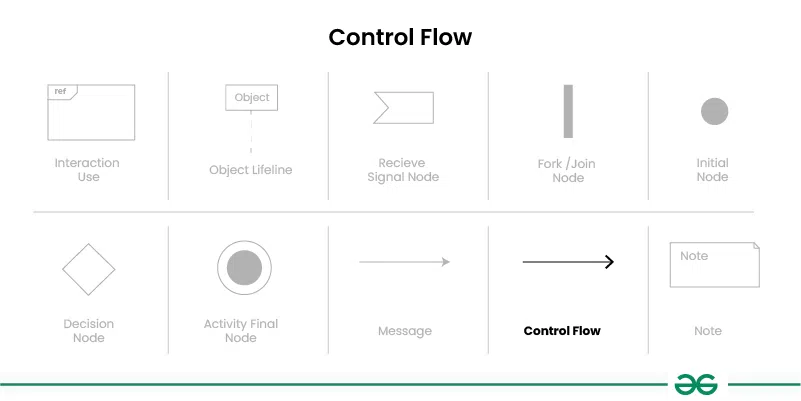
6. Control Flow
Represents the sequence of actions or flow of control in an interaction.
- Shown as a solid arrow connecting elements in the diagram.
- Indicates the order in which actions are executed.
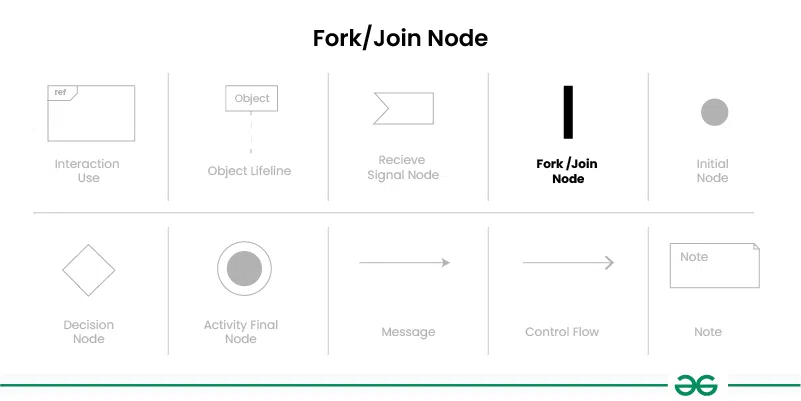
7. Fork Node/Join Node
Represents a point where parallel actions start or synchronize in the interaction.
- Shown as a solid rectangle (thick bar) in the diagram.
- Fork Node has multiple outgoing flows, while Join Node has multiple incoming flows.
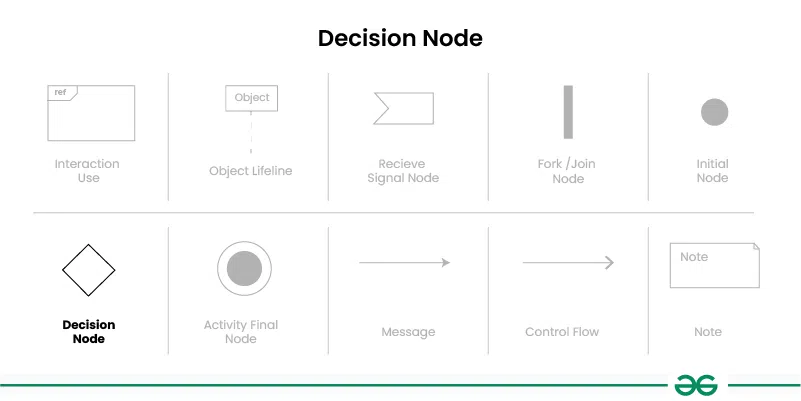
8. Decision Node
Represents a point where the flow branches based on a condition.
- Shown as a small diamond shape in the diagram.
- Directs control flow to different paths based on decision outcomes.
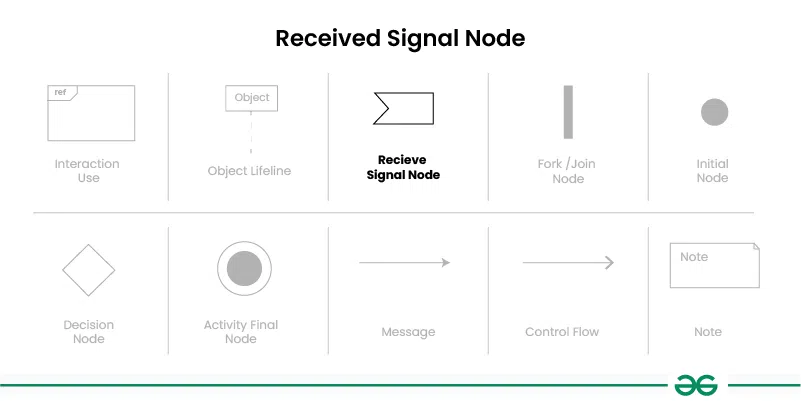
9. Receive Signal Node
Represents the receipt of a signal or event during the interaction.
- Shown as a small rectangle with an incoming control flow arrow.
- Waits for and responds to a specific event or signal.
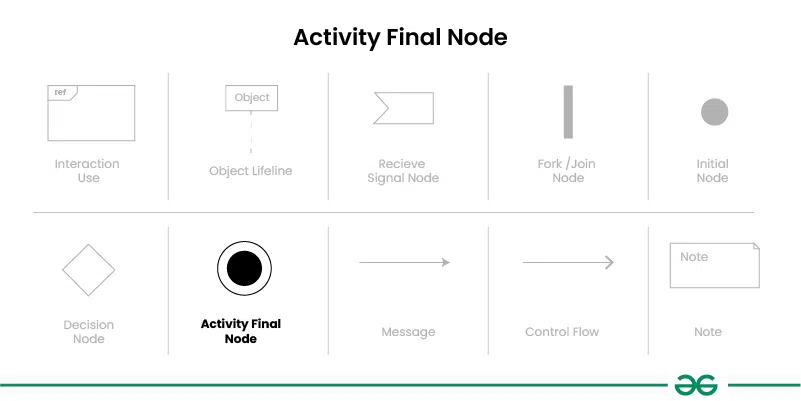
10. Final Node
Represents the ending point of an interaction.
- Shown as a small solid circle with no outgoing control flow arrows.
- Indicates that the interaction or process has completed.
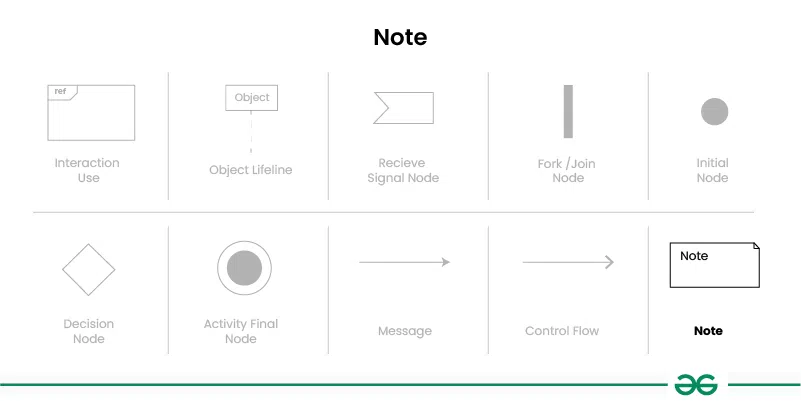
11. Note
Represents additional information or comments about the diagram.
- Shown as a small rectangle containing descriptive text.
- Used to provide explanations or clarify diagram elements.
Example
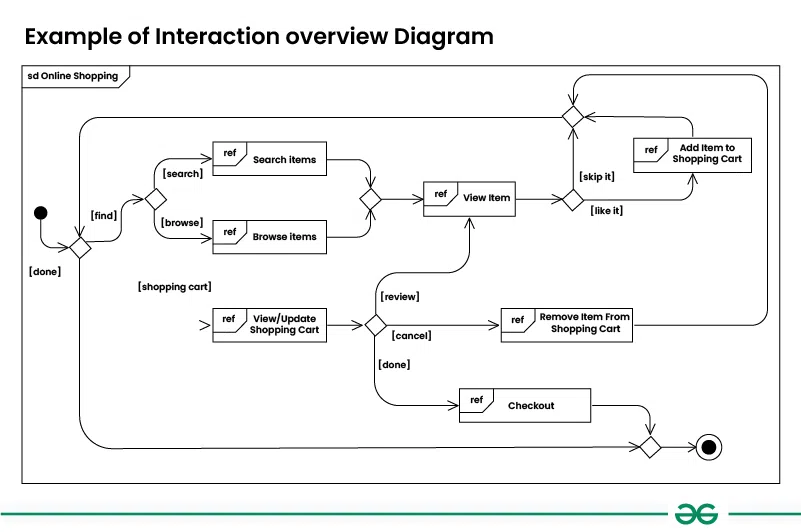
1. Online shopping interaction overview diagram
An Interaction Overview Diagram (IOD) for an online shopping system shows the overall flow of user interactions, such as logging in, browsing products, managing the shopping cart, and completing checkout. It also illustrates decision points (e.g., payment method selection) and parallel activities like inventory updates and invoice generation.
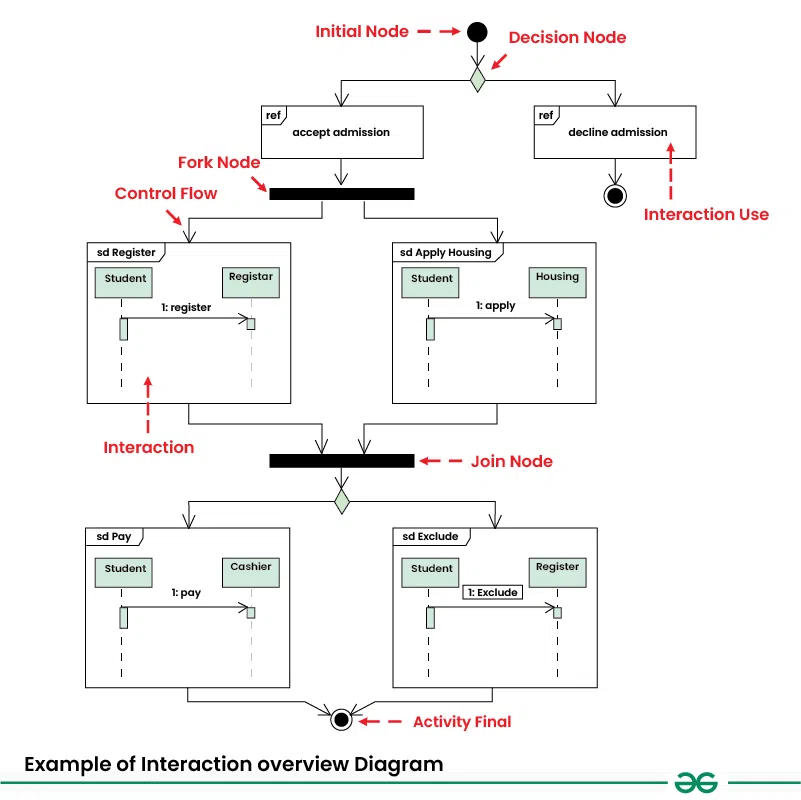
2. Student Admission Interaction Overview Diagram
An Interaction Overview Diagram (IOD) for a Student Admission System shows the admission workflow, including accepting or declining the admission offer, registering for classes, applying for housing, and making payment. It also highlights decision points and the consequence of non-payment, where the registrar may exclude the student from enrollment.
Benefits
An Interaction Overview Diagram provides a high-level view of interactions and control flow within a system, making complex processes easier to understand and analyze.
- Improves Understanding: Provides a clear visual representation of the system's control flow and interactions.
- Reduces Complexity: Simplifies complex processes by presenting them at a high level.
- Enhances Communication: Helps stakeholders share and discuss system behavior effectively.
- Supports Analysis and Improvement: Makes it easier to identify issues, optimize workflows, and evaluate design decisions.
Use Cases
Interaction Overview Diagrams are used to visualize the overall flow of interactions in a system, helping in design, analysis, documentation, and testing.
- System Design: Provides a high-level view of system interactions and control flow.
- Requirements Analysis: Helps validate and understand system requirements and user needs.
- Documentation: Serves as a visual reference for system behavior and architecture.
- Testing: Assists in creating test cases and identifying important test scenarios.
Software/Applications to make Interaction Overview Diagrams
The following programs and software tools can be used to create Interaction Overview Diagrams:
- Enterprise Architect
- Lucidchart
- Visual Paradigm
- Draw.io
- Microsoft Visio
- Creately
- Gliffy
- PlantUML
- Edraw Max
- SmartDraw
