

Unified Modeling Language (UML) is a standardized visual modeling language used to visualize, design, and communicate the structure and behavior of a software system. UML is not a programming language.
- The International Organization for Standardization (ISO) published UML as an approved standard in 2005. UML has been revised over the years and is reviewed periodically.
- UML provides a common notation for communicating system design among stakeholders.
Example: In an e-commerce system, a UML diagram can show components like User, Product, and Order, and how they interact during processes like placing an order.
Need of UML
UML is essential for clearly visualizing and communicating system design among different stakeholders involved in a project.
- Simplifies complex systems: Diagrams make large and complex systems easier to understand.
- Improves communication: Developers, designers, architects, and business stakeholders can use a common visual representation.
- Supports planning: Teams can visualize system structure, workflows, and interactions before writing code.
- Helps documentation: UML diagrams provide a clear reference for understanding and maintaining the system.
Types of UML Diagrams
Diagrams in UML can be broadly classified as:
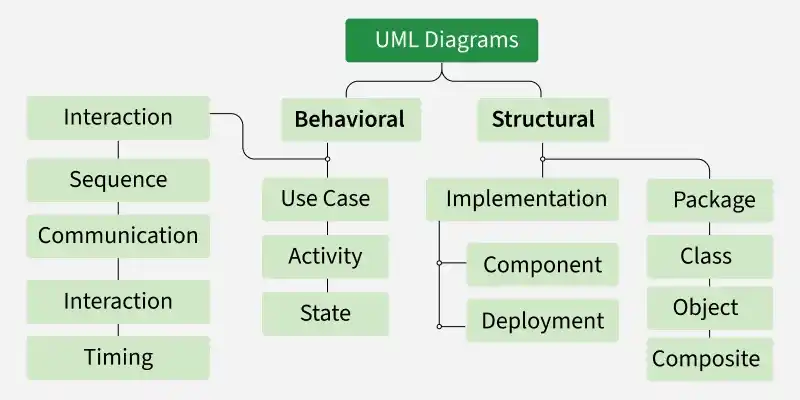
1. Structural UML Diagrams
Structural UML diagrams are visual representations that depict the static aspects of a system, including its classes, objects, components, and their relationships, providing a clear view of the system's architecture.
Structural UML diagrams include the following types:
1. Class Diagram
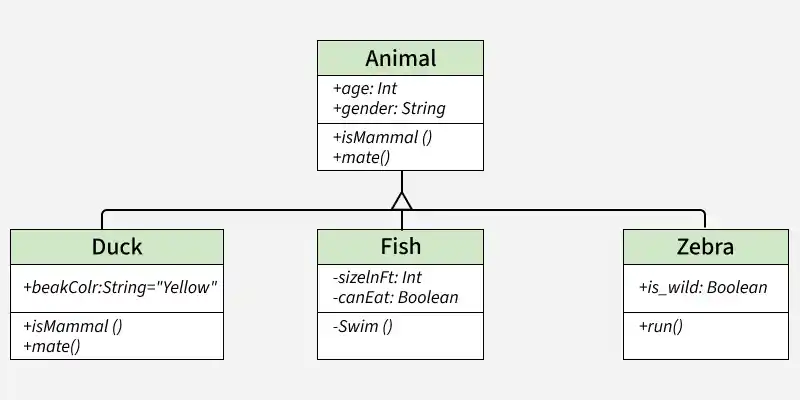
A class diagram is the most widely used UML diagram and a fundamental part of object-oriented software design. It represents the static structure of a system by showing its classes, attributes, methods, and relationships between classes.
- Class diagrams help visualize the structure of a system and its classes.
- They show relationships between different classes, such as association, inheritance, and dependency.
2. Composite Structure Diagram
A composite structure diagram represents the internal structure of a class or other structured classifier and shows how its internal parts interact with each other. It provides a detailed view of the parts, ports, and connectors that make up the classifier.
- It shows the internal parts and their relationships, including ports and connectors.
- It provides a detailed view of a classifier's internal structure, unlike a class diagram, which focuses on the overall class.
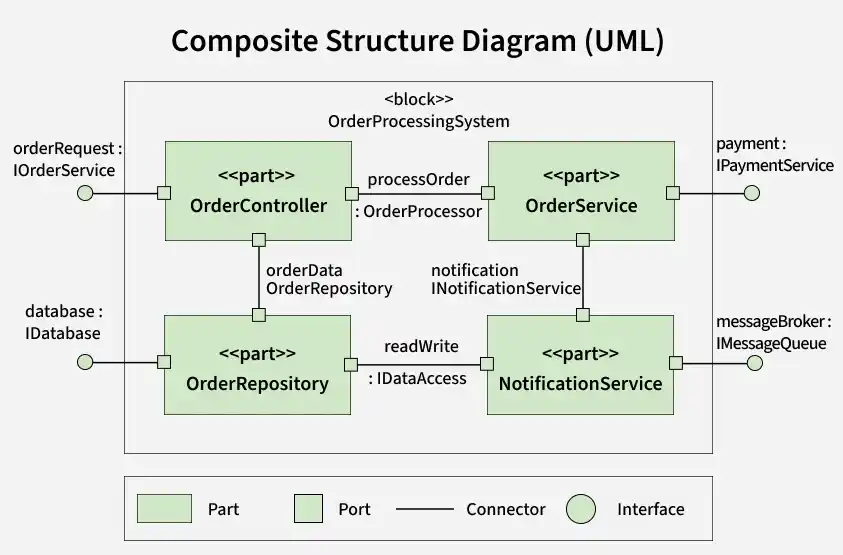
Example: Consider an Order Processing System where OrderController sends orders to OrderService, which uses OrderRepository to access the database and NotificationService to send notifications.
Thus, the diagram shows the internal parts of the system and how they interact with each other.
3. Object Diagram
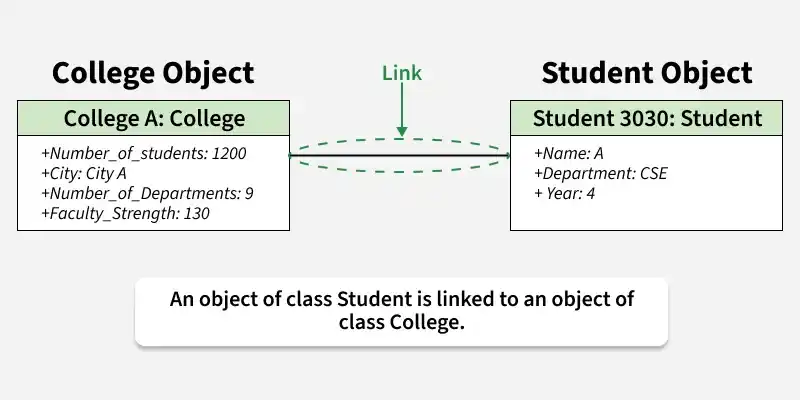
An object diagram represents a snapshot of a system at a particular point in time by showing instances of classes and the relationships between them. It helps visualize the actual state of objects after classes have been instantiated.
- Object diagrams show specific instances of classes and their relationships.
- They provide a snapshot of the system at a particular point in time, unlike class diagrams, which show the general class structure.
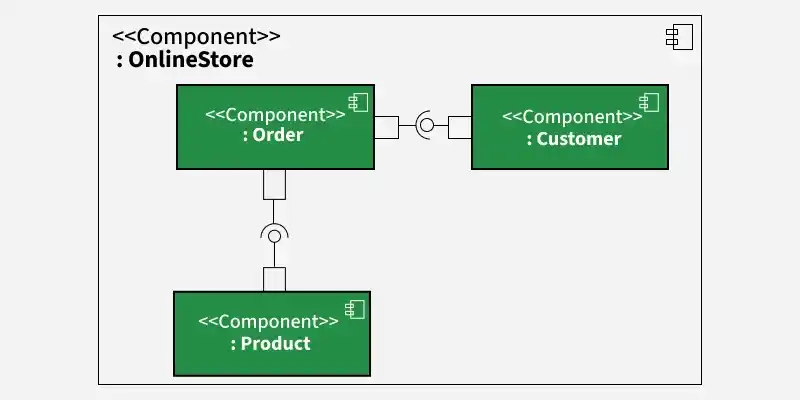
4. Component Diagram
A component diagram represents the organization and dependencies of the physical or replaceable components of a software system. It helps visualize how components are structured and how they communicate through interfaces.
- Component diagrams show the structural relationships and dependencies between system components.
- They are useful for complex and distributed systems, including microservices, to represent service boundaries, APIs, and communication.
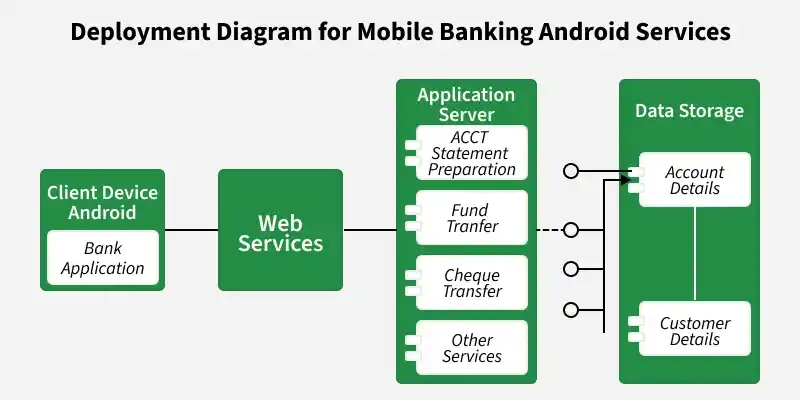
5. Deployment Diagram
A deployment diagram represents the physical arrangement of hardware and software in a system. It shows how software artifacts are deployed on and distributed across physical or virtual nodes.
- Deployment diagrams show the distribution of software artifacts across hardware or execution environments.
- They are useful for systems deployed across multiple machines with different configurations.
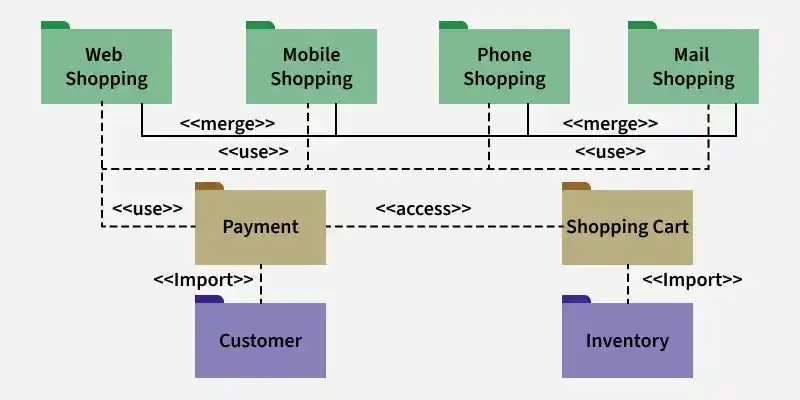
6. Package Diagram
We use Package Diagrams to depict how packages and their elements have been organized. A package diagram simply shows us the dependencies between different packages and internal composition of packages.
- Packages help us to organize UML diagrams into meaningful groups and make the diagram easy to understand.
- They are primarily used to organize class and use case diagrams.
2. Behavioral UML Diagrams
Behavioral UML diagrams are visual representations that depict the dynamic aspects of a system, illustrating how objects interact and behave over time in response to events.
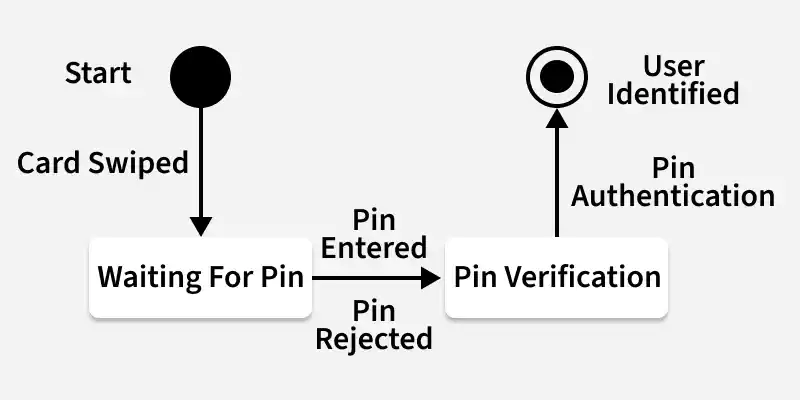
1. State Machine Diagrams
A state diagram is used to represent the condition of the system or part of the system at finite instances of time. It’s a behavioral diagram and it represents the behavior using finite state transitions.
- State diagrams are also referred to as State machines and State-chart Diagrams
- These terms are often used interchangeably. So simply, a state diagram is used to model the dynamic behavior of a class in response to time and changing external stimuli.
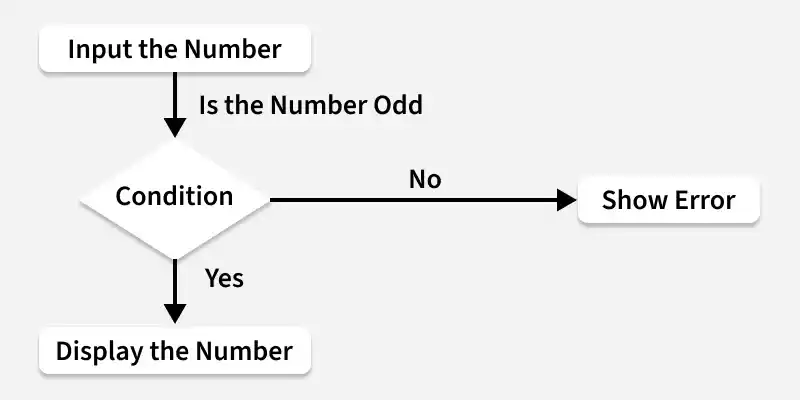
2. Activity Diagrams
We use Activity Diagrams to illustrate the flow of control in a system. We can also use an activity diagram to refer to the steps involved in the execution of a use case.
- Activity diagrams visually represent sequential and concurrent workflows in a system.
- They show the flow of activities, decisions, and events in a process.
3. Use Case Diagrams
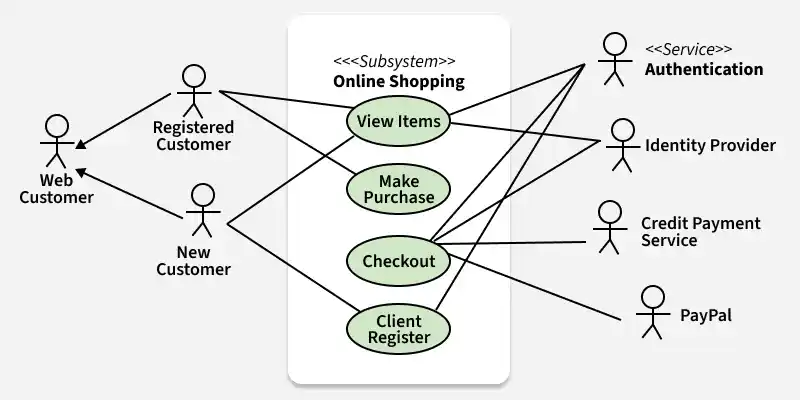
Use Case Diagrams are used to depict the functionality of a system or a part of a system. They are widely used to illustrate the functional requirements of the system and its interaction with external agents(actors).
- A use case is basically a diagram representing different scenarios where the system can be used.
- A use case diagram gives us a high level view of what the system or a part of the system does without going into implementation details.
4. Sequence Diagram
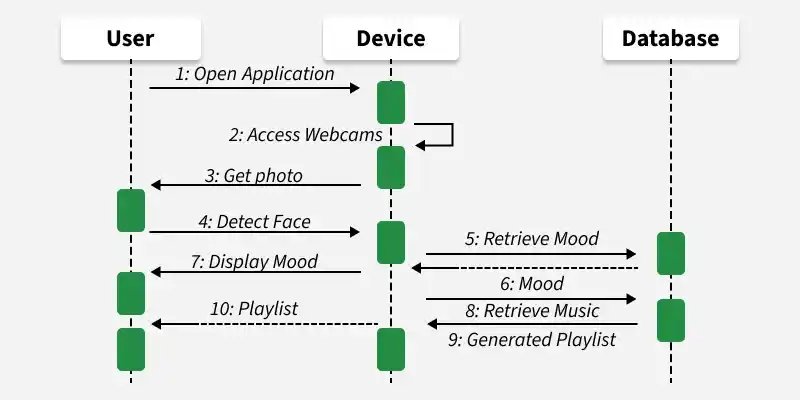
A sequence diagram simply depicts interaction between objects in a sequential order i.e. the order in which these interactions take place.
- Sequence diagrams show how and in what order objects interact within a system.
- They help document and understand system requirements by showing interactions between objects over time.
5. Communication Diagram
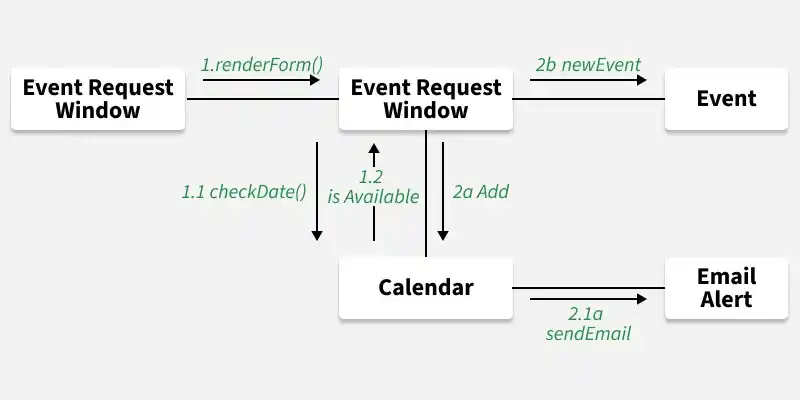
A Communication Diagram (known as Collaboration Diagram in UML 1.x) is used to show sequenced messages exchanged between objects.
- A communication diagram focuses primarily on objects and their relationships.
- We can represent similar information using Sequence diagrams, however communication diagrams represent objects and links in a free form.
6. Interaction Overview Diagram
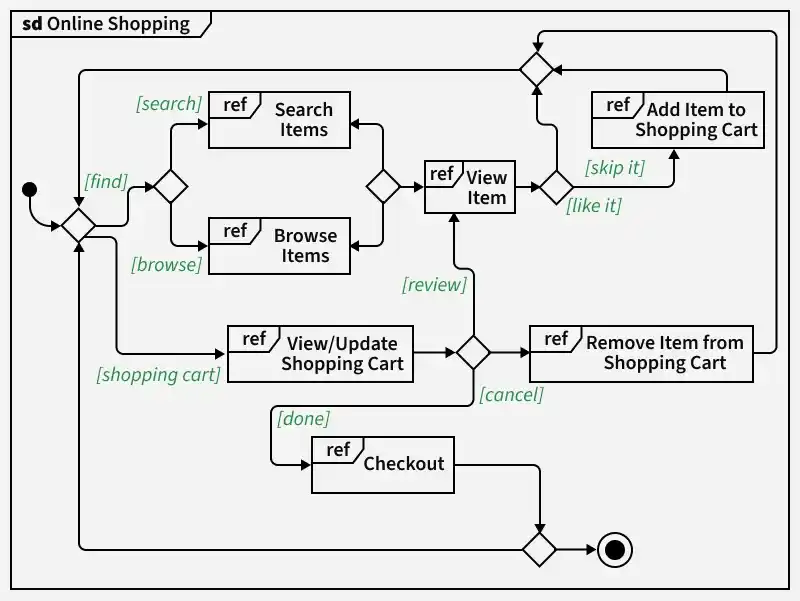
An Interaction Overview Diagram (IOD) is a type of UML (Unified Modeling Language) diagram that illustrates the flow of interactions between various elements in a system or process. It provides a high-level overview of how interactions occur, including the sequence of actions, decisions, and interactions between different components or objects.
Additions in UML 2.0
- Software development methodologies like agile have been incorporated and scope of original UML specification has been broadened.
- Originally UML specified 9 diagrams. UML 2.x has increased the number of diagrams from 9 to 13. The four diagrams that were added are : timing diagram, communication diagram, interaction overview diagram and composite structure diagram. UML 2.x renamed statechart diagrams to state machine diagrams.
- UML 2.x added the ability to decompose software system into components and sub-components.
Tools for creating UML Diagrams
Several tools are available for creating UML diagrams to visually represent software systems.
- Lucidchart: A web-based tool for creating and collaboratively editing UML diagrams.
- Draw.io: A free diagramming tool that supports UML and integrates with cloud storage services.
- Visual Paradigm: A comprehensive software development tool that supports various UML diagrams.
- StarUML: An open-source UML modeling tool that supports UML 2.x diagrams and extensions through plugins.
