Showing posts with label Sulfur. Show all posts

Monday, August 9, 2010

Io Volcano of the Week: Emakong

This month for my Io Volcano of the Week series, we are looking at volcanoes that were observed at moderate resolution (160-280 meters or 525-920 feet per pixel) during Galileo's I25 flyby of Io on November 26, 1999.  Last week, we examined Zal Patera, a large volcano on Io's northern hemisphere that has been the site of large lava flows and a small volcanic plume.  This week we take a look at Emakong Patera, a large lava lake smack dab in the middle of Bosphorus Regio.  While a largely inactive lava lake during the Galileo mission, high-resolution observation of this volcano by the camera and near-infrared spectrometer on Galileo have relaunched the debate over the predominance of sulfur and silicate volcanism on Io.

Emakong Patera, like Zal Patera described last week, is a larger than average, roughly heart-shaped patera, or volcanic depression, being 79 kilometers (49 miles) long north to south and 72 kilometers (45 miles) wide west to west.  The name of the volcano is derived from the mythology of the Sulka people of the southeast coast of the island of New Britain in Papua New Guinea.  In the myth, Emakong dives into a stream to retrieve an ornament he dropped.  Upon reaching the bottom, he found that he was in the yard in front of a house.  The people from this house allowed him to stay for the night around the hearth fire, both alien concepts to Emakong.  The next morning, Emakong was given night and fire as gifts to bring back to his own people.  Unlike another volcano named for a mythical fire bringer, Prometheus, Emakong had never been seen as a very active volcano, despite its dark surface and numerous surrounding lava flows.

The surrounding lava flows however, are not dark but are bright instead.  Bright white to yellow flows radiate for up to 370 kilometers (230 miles) from the edge of Emakong across much of Bosphorus Regio.  Based on medium-resolution imagery acquired in November 1999, researchers discovered that some of these flows are fed by narrow channels that formed when lava overflowed the walls of the Emakong basin.  Other bright flows, particularly along the western margin of Emakong, appear to be broader over-flows from the patera.  Galileo scientists suggests that rather than being composed of silicate basalt like most of the lavas seen on Io, instead Emakong's lava flows are composed of sulfur.  When quenched at different temperatures, cooled sulfur flows can have different colors.  The higher the quenching temperatures, the darker and red the cooled flows appear.  So it would follow that the cooled sulfur lava in the channels that feed the bright flows and on the floor of Emakong Patera is darker than the bright flows themselves, as they were quenched at higher temperatures.

Alternatively, the flow may have originated as a silicate flow that was over time covered more and more by sulfur.  Such as process is seen at Chaac Patera, where brighter sulfur ponds in the valleys within the silicate lava that covers the patera.  Over time, this slowly brightens the lava flow.  Like Chaac, Emakong also has a greenish color, thought to form from the interaction between cooling, iron-rich silicate lavas and sulfur.  Personally, I prefer this theory over one that suggests that this is a sulfur flow.  During the Galileo and New Horizons, several examples were observed where bright yellow flows were covered over by basaltic lava during more recent high-temperature eruptions.  This provides a potential connection between current activity on Io and earlier activity, though there are examples on Earth where the same volcanic vent has been known to release both sulfur and silicate lava.  While Emakong has been generally inactive in the current epoch, it is always possible the volcano may later re-activate these flows, forming broad silicate lava flows to cover the older sulfur-coated flows.

Emakong and the dark channel that flows to the east from its margin were imaged at high spatial resolution by both the SSI and NIMS instruments on Galileo in October 2001.  The mosaic at right shows the southwest margin of Emakong Patera with its dark band of hot lava along its outer margin.  The dark channel that is the focus of this observation starts out as a crusted over, multi-braided channel near the edge of Emakong before turning into an open channel after flowing a few kilometers to the east.  The morphology of the channel in this region is similar in appearance to lava lake overflow channels that have formed at Kilauea when the overflow occurs over an entire sector of the lake with hot, low-viscosity lava that had a variable flow-rate.  The flanks of the channel are formed by relatively dark material, which is itself surrounded by bright material.  Further downstream, the channel becomes broader and progressively more crusted over, suggestive of the transition from an open channel lava flow to a lava tube.

The mix of bright and dark material in the plains southwest of Emakong Patera is difficult to assess.  The lack of clear topographic shading makes it difficult to even determine whether bright material lies on top of dark, or vice versa, which is needed to determine stratigraphy of these lavas.  The shading nearer the lava channel does suggest that lava over flowing the channel is initially dark before becoming bright, which could occur if hot sulfur is quenched near the channel, while cooler sulfur is quenched more distally.  Strangely, the interplay between bright and dark does appear similar to another Galileo observation, a 5.5-meter (18-foot) per pixel mosaic east of Isum Patera taken in February 2000.  In both cases, the complexity of the scene makes it difficult to assess the relationship between bright and dark material.  In both cases, a bright lava flow is covered at high-resolution. Discussion of that observation may have to wait for another day.

What of Emakong Patera itself, what type of volcanic activity occurs there?  The patera was not seen as a hotspot until the Galileo flybys in November 1999 and February 2000.  These low-resolution observations indicated the presence of either cooled silicate or warm sulfur flows on the floor of the volcano.  A high-resolution (2 kilometers or 1.25 miles per pixel) NIMS observation was obtained over Emakong Patera during a Galileo flyby in October 2001.  This observation confirmed the presence of warm material on the floor of the patera, at least compared to the surrounding terrain.  While much of the patera floor had a consistent temperature, the margins were much warmer, reaching a peak near 270 ± 90 K (26±194°F).  This observation is consistent with a quiescent lava lake, as the warmer temperatures along the margin correlate with a ring of dark material that lines the outer margins of the patera.  The temperatures detected by NIMS are still too cool for even molten sulfur (unless it is highly impure and forms a low-temperature eutectic), suggesting that regardless of whether Emakong is a site of sulfur or silicate volcanism, it was relatively inactive during the Galileo mission (and there is nothing to suggest that this has changed since the mission ended).  The temperatures within Emakong are also low enough for sulfur dioxide frost to be detected in the same pixel as a thermal hotspot, the only place on Io this has been detected.

While the debate between the predominance of sulfur or silicate volcanism has been settled for much of Io in favor of silicate volcanism, Emakong is one of several locations where uncertainty remains.  Regardless of whether sulfur or silicate volcanism dominates at Emakong, it has been years since it was last active beyond thermal emission from warm lava leaking out through cracks in the crust of the Emakong lava lake, unless the sulfur is highly impure and forms a low-temperature eutectic.  The large bright lava flows surrounding Emakong tell the tale of past glory for the volcano, which may one day erupt again to flood hundreds of square kilometers in hot silicate or sulfur lava.

References:
Williams, D.; et al. (2001). "Evaluation of sulfur flow emplacement on Io from Galileo data and numerical modeling". Journal of Geophysical Research 106 (E12): 33,161–33,174.
Keszthelyi, L.; et al. (2001). "Imaging of volcanic activity on Jupiter's moon Io by Galileo during the Galileo Europa Mission and the Galileo Millennium Mission". Journal of Geophysical Research 106 (E12): 33,025–33,052.
Turtle, E.; et al. (2004). "The final Galileo SSI observations of Io: orbits G28-I33". Icarus 169: 3–28.
Lopes, R.; et al. (2004). "Lava lakes on Io: observations of Io’s volcanic activity from Galileo NIMS during the 2001 fly-bys". Icarus 169: 140–174.

Tuesday, August 3, 2010

Volcanic Moon of Jupiter Is Not Smelly and is Fun for the Whole Family

Back in mid-June, Space.com had a news article posted on their website titled, "Volcanic Moon of Jupiter Is Smelly and Bizarre."  The article was promoting the results of a paper by Arielle Moullet, Mark A. Gurwell, Emmanuel Lellouch, and Raphaël Moreno that presented results of Sub-Millimeter Array (SMA) surveys of Io's atmosphere. Their observations revealed the presence of the previously observed compounds in the atmosphere like sulfur dioxide (SO2) and sulfur monoxide (SO) and a compound observed for the first time in gaseous phase, sodium chloride (NaCl), which was predicted to exist based on the presence of sodium and chlorine in the Io Plasma Torus.  The SMA data also allowed the authors to map the distribution of these molecules, again including NaCl for the first time.  Finally, they analyzed the origin of each species, either sublimation from surface frost (the main source of SO2), photolysis from larger molecules (the dominant source of SO), or volcanic activity (the primary source for NaCl).  We discussed this paper on this blog back in March, and you can read that entry for more information about the results from this paper.

Back to the news article I mentioned at the top.  Space.com's reporting generally wasn't too bad.  It seemed to focus less on the results of the research than on the importance of it: the need to explain the source of the gases in Io's atmosphere given how small it is.  After all, our Moon is about the same size and has a much  thinner atmosphere composed mostly of sputtered regolith and outgassed radioactive decay products.  Understanding the connection between the atmosphere and Io's volcanic activity seems to be the key, along with how Io's atmosphere interacts with Jupiter's powerful magnetosphere, which acts as a sink for gases in the atmosphere.  The article also briefly reminds people about Io's active geology and possible future missions that may further explore this question of the source of Io's atmosphere.

Where the article goes off track is its description of Io's smell and derives mostly from the sentence, "She conceded the moon isn't a very pleasant place, though, because of the rotten-egg smell of the sulfur gases."  On the face of it, I could let it pass since it really feels like a throw-away comment.  However, many other sites re-reporting what Space.com wrote, particularly this gem from the Mother Nature Network titled, "Jupiter's moon smells like giant rotten eggs" or this one from the Christian Science Monitor called, "Scientists discover that Jupiter moon smells terrible".  These articles focused less on the science of the original paper (though both do provide an overview of the moon for readers who were unfamiliar), and more on that comment about how Io smells like rotten eggs, based on this discovery.

To this, I have (and had at the time I saw these stories come out) but one reaction:

Well, let me make it clear lest I am misunderstood.  For this purpose, I will employ the caps lock button on my keyboard, so look away if you think you might be offended by its use.  IO DOESN'T SMELL BAD.  IT DOESN'T SMELL LIKE ROTTEN EGGS.  Sorry about that.  It had to be done.  The known chemical components of Io's atmosphere smell no worse than burnt matches.  Sure, the smell of burnt matches may not smell nice say compared to a rose, German Chocolate Cake, or very good barbecue, but I think we can all agree that it is a far cry from rotten eggs or raw sewage.  The bad smell that people associate with sulfur actually comes from hydrogen sulfide, not from sulfur, which only has a faint odor.  Hydrogen sulfide is produced as a waste product by intestinal and other bacteria and through hydrolysis at volcanic centers on Earth.  Its presence in Io's atmosphere has only been hypothesized and it has not been definitively identified.  It certainly wasn't observed by Moullet et al.  Organic sulfides can also have a pungent odor, but those are much less likely to be present in Io's atmosphere.  The other component Moullet et al. observed in the atmosphere of Io was sodium chloride, which is just plain old table salt.

So again, the story here is the all-to-common failure of science reporting on the web, picking up on unimportant trivia (that in this case isn't true) or more often than not, no fact checking and instead just passing along verbatim either what other websites report or copying press releases.  In this case, it just passes along misinformation rather than reporting on the original paper that spawned Space.com's story, thus trivializing its results to merely state that "Scientists discover that Jupiter moon smells terrible".

Again, the reports of Io's bad smell are greatly exaggerated. The moon is still a great place to vacation!  ;-)

Link: Volcanic Moon of Jupiter Is Smelly and Bizarre [www.space.com]
Link: Jupiter's moon smells like giant rotten eggs [www.mnn.com]
Link: Scientists discover that Jupiter moon smells terrible [www.csmonitor.com]

Wednesday, February 3, 2010

LPSC 2010: Re-examining the Iothermal Gradient

For the last couple of weeks, we have been examining the Io-abstracts submitted for next month's Lunar and Planetary Science Conference.  Today we take a look at a paper submitted by Giovanni Leone, Lionel Wilson, and Ashley Davies titled, "The Geothermal Gradient of Io: Consequences for Lithosphere Structure and Volcanic Eruptive activity." For this paper, the authors modeled the structure of Io's lithosphere by calculating how its temperature varies with depth.  This research will be presented as a poster at the Igneous and Volcanic Processes session on Thursday, March 4.

Io's internal heat, generated by tidal stresses on Io's mantle, is released through volcanic activity in a process called advection.  As opposed to convection or conduction, with advection, heat is transported from a system through a warm liquid, in this case, liquid hot magma.  The model used by Leone and his colleagues was first developed in O'Reilly and Davies 1981 in order to explain how Io's lithosphere could be releasing so much heat (2.4 Watts per m2) yet still hold up Io's steep paterae walls and tall mountains.  A conducting crust would be far too warm at shallow depths and too thin to hold up these structures.  Thus, thanks to advection, all of the internal heat from the asthenosphere is released through volcanic eruptions and the lithosphere stays pretty cool except for the lower two to three kilometers of the 30-kilometer thick lithosphere, preventing viscous relaxation of Io's topography (see the craters of Saturn's moon Enceladus to see how viscous relaxation can distort topography).

For their model, Leone et al. used two equations from O'Reilly and Davies 1981 as well as improved knowledge about the chemistry and properties of Io's lithosphere to calculate the geothermal (or iothermal, if you will) gradient within the lithosphere, from the cold (100 K) surface to the lithosphere/asthenosphere interface at a depth of 30 kilometers and a temperature of 1500 K. Their inputs include estimates for the porosity of the lithosphere as a function of depth, the density of the magma, the globally-averaged, advected heat flux, radiogenic heatign rate, the magma specific heat, latent heat of crystallization, and thermal diffusivity. From these equations, the authors derived the lithospheric density, pressure, and temperature at different depths in Io's lithosphere. As expected, the lithosphere remains below the melting point of sulfur dioxide from the surface down to a depth of 21 kilometers. It remains below the melting point of sulfur until a depth of 26 kilometers. Much of the lithospheric heating takes place in the bottom few kilometers of the lithosphere.

The iothermal gradient generated by Leone's model does support the transport of magma all the way to the surface. Without any entrained volatiles, magma from the asthenosphere can rise to a depth of 23 kilometers before becoming negatively buoyant and forming magma reservoirs, assuming a pore-space fraction of 30% at the top of the lithosphere. As mentioned above, this is within the depth range of the melting point of the dominant volatiles on Io, sulfur and sulfur dioxide. These may then become entrained in the lava, allowing the magma to rise further to the surface. Leone et al. conclude that with volatile contents as low as 5% by mass, magma should be able to reach the surface using reasonable values for lithospheric porosity. With even more volatiles, such as the 10-30% suggested at some plume sites like Tvashtar, the modeled iothermal gradient would support the kinds of high eruption speeds observed at that volcano. They conclude "that there should be a positive correlation between mass eruption rate and volatile content." So it should not come as a surprise that major eruption on Io, like Tvashtar 1999/2001/2007, Thor 2001, Grian 1999, and Pillan 1997 all had volcanic plumes.  Finally, they also place a limit on the porosity of Io's lithosphere at the surface at 38% as magma could not ascend into the lithosphere above that level, the crust would be too light.

Another factor that the authors examined was the effect that changes in the advected heat flow would have have on the lithosphere.  Just as Kirchoff and McKinnon found last year, a decrease in volcanic activity but not a decrease in the amount of heat generated in the mantle (i.e. the temperature remains the same) would leading to a heating of the lower to mid-lithosphere, possibly leading to some melting.  In Leone's model, the gradient changed from a steep curve at 2.4 W/m2 (remaining relatively cool until close to the lithosphere/asthenosphere boundary) to a much shallower one at 0.5 W/m2.

With this model of Io's geothermal gradient, Leone and his co-authors have placed limits on the amount of pore spaces are possible in Io's lithosphere.  Their model is supported by their ability to replicate the ascent of magma to the surface, which is readily visible on Io's surface.  Their model also helps support the argument that the volatiles in Io's lava are incorporated into its magma within reservoirs in the lithosphere.  I would be interested to see how this model fits with the view that the upper 2-3 kilometers of Io's lithosphere maybe dominated by volatiles with silicates being predominant deeper into Io.

Link: The Geothermal Gradient of Io: Consequences for Lithosphere Structure and Volcanic Eruptive activity [www.lpi.usra.edu]

Saturday, January 2, 2010

The Chemical Composition of Io

From the comments on the 2009 Fall AGU meeting abstracts post back in October, I think it might be useful to have an overview post on what is known about Io's composition and the volatile chemistry that takes place at Io's volcanoes and in its atmosphere.  Much of the information I will present here is based on models of the kinds of chemical reactions that are thought to occur, but a few key measurements do underlie this discussion.  This first is Io's bulk density, derived from measurements of Io's size and Io's effect on passing spacecraft and its fellow Jovian satellites.  The latter measurement allows for an estimate of Io's mass.  Second, spectroscopic measurements of Io's surface and atmosphere provide details on the sulfurous volatiles that are common at Io's volcanoes and cover the bulk of Io's surface.  Finally, in situ and spectroscopic measurements of the composition of the Io Plasma Torus, a belt of charged particles co-orbital with Io, provide hints to the atomic breakdown of compounds that escape from Io and its atmosphere.

Io's Interior Composition

Io has the highest bulk density (3.53 g/cm3) of any object in the outer solar system.  This high density suggests that Io is composed primarily of silicates with a metallic iron or iron sulfide core.  Unlike nearly all the other moons in the outer solar system, very little water exists on the surface as Io formed inside the Jovian "snow line", where relatively little water condensed compared to those moons outside the snowline like Ganymede and Callisto.  What little water Io did retain was later lost as Io's became a more active body.  Thus, sulfurous compounds became the dominant volatiles on Io as the original metal sulfides in Io's interior became oxidized.

Based on Io's density and moment of inertia measurements (which allow for estimates of the size of Io's core), Io's bulk composition is thought to match that of ordinary L- and LL-chondrites, based on modeling work by Kuskov and Kronrod 2001.  This suggest a low metallic iron content, with most of the iron and other metallic elements (like magnesium, aluminum, and titanium) tied up in oxides.  Model runs by Keszthelyi et al. 2007 assumed a refractory composition of 36% SiO2/30% FeO/25% MgO bulk composition with the majority of the iron tied up in the core.  The rest of the bulk refractory composition was taken up by additional oxides with potassium, calcium, sodium, and aluminum.

Io's core consists primarily of iron with some unknown percentage of iron sulfide (up to 37% by weight for the iron/sulfur eutectic.  Because the amount of sulfur in the core is not known, the size of Io's core is only known as a range of sizes from 37% (assuming pure iron) to 52% (assuming an Fe-FeS eutectic mixture) of Io's radius.


Silicate Lavas

Based on temperature estimates from Galileo and ground-based observations of active volcanoes and near-infrared imaging by Galileo, Io's dark lava flows, diffuse pyroclastic deposits, and lava lakes are thought to be mafic to ultramafic in composition, high in magnesium and iron oxides and low in silica.  Minerals typically found in mafic basalt flows include plagioclase feldspar, olivine, and pyroxene.  The identification of Io's lava flows with basalt (rather than sulfur, as presumed following Voyager) is based in part on the high temperatures measured by the SSI camera on Galileo.  Initial temperature estimates in McEwen et al. 1998, based on the ratio of the observed brightness between the clear and 989 nm filters of Pillan during the summer 1997 eruption and other volcanic centers like Pele and Kanehekili, suggested ultramafic compositions for at least some of Io's lavas.  However the lower limit of 1600°C was found to be an overestimate, as new cooling models taking lava fountains into account and reprocessing of the Galileo data, suggested lava temperatures between 1250 and 1350°C, more in line with models of Io's mantle and tidal heating and with ordinary mafic compositions.  However, these estimates may underestimate the eruption temperature as the observed temperatures may be several hundred kelvin cooler after only a few seconds of cooling, so ultramafic compositions (less iron and more magnesium than regular mafic magmas) are not completely ruled out.  In addition, the eruption temperature may not be reflective of the liquidus temperature of the magma due to super-heating of the magma as it ascends to the surface.

Another piece of evidence toward the composition of Io's lavas is the presence of an absorption band at 0.9 μm associated with dark regions on Io found in SSI images taken with the 889 nm filter (identified in Geissler et al. 1999).  This absorption band has been associated with orthopyroxene, either the magnesium end member mineral enstatite (Mg2Si2O6) or the magnesium/iron mixture mineral (what used to be known as hypersthene).  Either mineral is consistent with a mafic or ultramafic composition for Io's primary lavas.  The model Io lithosphere used by Keszthelyi et al. 2007 (which would consist primarily of cooled lava flows) is similar in composition to terrestrial tholeiitic basalt, but with less silica (SiO2) and titanium oxide and more magnesium oxides.

Volatiles

The predominate volatiles, i.e. chemicals that can be sublimated or condensed at normal Io temperatures, are sulfur and sulfur dioxide (SO2).  In fact, SO2, the SO2 photolysis product sulfur monoxide, and the various allotropes of sulfur are the only volatiles that have been definitely identified on Io's surface and in its atmosphere and volcanic plumes.  These two are also largely responsible for Io's colorful appearance.  Course grained sulfur dioxide is responsible for the white-gray regions seen across Io's surface, including the large Colchis and Bosphorus regions seen in the color C21 mosaic.  Finer grained sulfur dioxide is more transparent at visible wavelengths, but can be identified using near-infrared absorption bands.  Band depth and width maps using near-infrared spectral data from Galileo has been used to create maps of SO2 abundance and grain size across Io in paper such as Doute et al. 2001. Sulfur dioxide is also the dominant chemical species in Io's plumes (from re-volatilized surface frost) and atmosphere and the deposition of which can produced bright regions surrounding volcanic plume vents.  Finally, sulfur dioxide maybe a primary lava in some areas, such as the bright floor of Balder Patera, during the early stages of patera formation as terrain above a sill starts to melt.

Sulfur in various forms can be seen across Io's surface as red, red-brown, orange, and yellow region across its surface.  Diatomic sulfur (S2) is outgassed from Io's interior during volcanic eruptions, in some cases forming large plumes (along with condensing sulfur dioxide) such as those at Pele or Tvashtar.  S2 is quickly reorganized into reddish S4, by photolysis, when it is deposited on the surface, helping to create the large red rings seen around some active volcanoes on Io.  Over time, continued photolysis builds sulfur into the stable cyclic S8 form, which is yellowish in color.  This is why plume deposits from briefly active volcanoes eventually fade back to the earlier appearance from before the eruption (like at Grian Patera).  At Io's poles, where charged particles can more easily reach the surface, cyclic sulfur can be broken back down into S4 form, producing Io's dark, reddish-brown polar regions.

Additional volatiles have been suggested for Io based on models of Io's volcanic gas chemistry, tentative identification of absorption bands in near-infrared spectra of Io's surface, and spectra of the neutral cloud that surrounds Io.  For example, additional sulfur oxides are likely in Io's atmosphere, such as sulfur monoxide (SO) and polysulfur oxide (SxO) based on models of Io's gas chemistry.  Additional thermochemical models of Io's volcanic gases suggest that sodium chloride would be a dominant salt in Io's plumes, and this is support by the identification of Na+ and Cl- in the Io Plasma Torus and NaCl in the dust streams that radiate out from Jupiter and have been associated with Io.  Potassium chloride is also likely.  Sulfuryl chloride (Cl2SO2) was tentatively identified at 3.92 μm within the reddish plume deposit at Marduk by Schmitt and Rodriguez 2003.  Those authors also suggested that Cl2S might be the cause for the red color of the deposit, though how this fits with the ability for other reddish deposits to fade rather quickly is not certain.  Kargel et al. 1999 attributed Io's reddish material to impurities in Io's volcanogenic sulfur, such arsenic and selenium, which can drastically change the color of sulfur even at very low concentrations (~1%).  They also suggested that the green color of some paterae on Io, like Chaac Patera, may result from the interaction between sulfur and cooling, iron-rich lavas, forming pyrite

Finally, water or at least hydroxyl may have been identified on Io by way of a 3.15 μm absorption band and a broad one found at 3 μm in the low spectral resolution NIMS data from the flybys. The 3.15 μm band was initially found in ground-based data by Salama et al. 1990 and identified with either H2O or H2S.  However the lack of a corresponding 2.97 μm feature suggests another culprit for this absorption band, perhaps HCl.  The 3 μm band is observed in high-spatial, but low-spectral, resolution data at several mountain structures, such as Gish Bar Mons, Tvashtar Mensae, and Tohil Mons.  One possible explanation is that these features maybe the result of water ice or hydrous minerals deposited on Io by small cometary impacts in the last million years that have been brought back to the surface by the uplift of these mountains.  However the lack of other water ice absorption bands at 1.48 and 2.0 μm led Granahan in 2004 to look for another compound that might create the observed band at 3 μm.  He identified pyrite (FeS) or pyrrhotite as possible compounds responsible for the absorption bands. 

Of course many of the chemical identifications on Io (save sulfur and sulfur dioxide) are either tentative or are based on chemical models of Io's volcanic gases or photolysis of gases in its atmosphere and plumes.  Additional spectroscopic studies with much higher spectral resolution than what was obtained by Galileo during its Io flybys will be needed to settle many of our questions about Io's surface composition.  Information on the eruption temperature of Io's lavas, in situ mass spectroscopy of its atmosphere and plumes, and gravity estimates of its interior structure will also be needed to refine our knowledge of Io's bulk composition.  The measurements will hopefully await us in the 2020s with IVO and JEO.

Thursday, September 17, 2009

Paper: Spectroscopy of Io Eclipse Reappearances

Last week, a new paper was published in press (the paper has been approved for publication, but hasn't found a slot in the dead-tree version of the journal yet) in the journal Icarus discussing spectroscopic observation of Io as it emerged from the shadow of Jupiter. The paper is titled "Eclipse reappearances of Io: Time-resolved spectroscopy" and was written by Dale Cruikshank, Josh Emery, Katherine Kornei, Giancarlo Bellucci, and Emiliano d'Aversa.

In this new paper, the authors discuss spectroscopic observation of Io acquired using NASA's Infrared Telescope Facility (IRTF) in Hawaii during five eclipse reappearances in April, May, and June 2004. These observations were intended as a follow-up to results from Cassini VIMS observations in Bellucci et al. 2004 taken during that spacecraft's Jupiter flyby during New Year's 2001 that showed a brightening of Io's surface in the near-infrared and a deepening of several strong sulfur dioxide absorption bands following Io's emergence from Jupiter's shadow. This result continues a 40-year-long mystery concerning the interaction between Io's atmosphere and its surface during and after an eclipse by Jupiter.

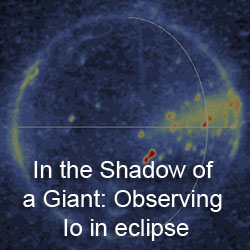
Unlike lunar eclipses, when the Earth passes between the Sun and our Moon and which happen about once a year, or every 13 orbits of the Moon around the Earth, eclipses of Io by Jupiter occur about once each Ionian day. This is due the large size of Jupiter compared to Earth and the much lower axial tilt of Jupiter and its main satellite system. Each Ionian lunar eclipse lasts about 2 hours and 22 minutes. During this time, the temperature of Io's surface cools due to the sudden lack of sunlight. As Io cools down as the eclipse progresses, atmospheric Sulfur dioxide (SO2) condenses onto the surface. Check out a post I wrote earlier this year on another paper for more details on this process.

Depending on the amount of SO2 that condenses onto the surface, the fresh frost should be visible shortly after Io emerges from behind Jupiter's shadow as a brightening of Io's surface compared to its appearance prior to being eclipsed, and it should quickly dim as the frost sublimates from the surface now that the Sun is able to heat it up. In addition, the strong SO2 absorption bands at 3.56 μm, 3.78 μm, 4.07 μm, and 4.37 μm would be deeper than they were prior to the eclipse and should become shallower during the first 60-90 minutes after each eclipse and particularly in the first 15 minutes as the fresh, fine-grained SO2 frost sublimates back into the atmosphere. Results from multiple studies using ground-based and spacecraft observations over the last 40 years, since Binder and Cruikshank 1964 revealed a brightening of Io of 10 percent following an eclipse by Jupiter, have been inconsistent with some showing such a brightening, and others showing none. As explained in this new paper, Nelson et al. 1993 found that post-eclipse brightenings are likely to be rare as a fresh SO2 frost layer several millimeters thick would be required to explaining the magnitude of the brightenings that were seen, and it would take longer than 15 minutes to sublimate that layer away. In addition, modeling of Io's atmosphere during an Io eclipse by Moore et al. 2009 suggests that SO2 condensation onto the surface would be curtailed to some degree by atmospheric heating by the Io plasma torus and by non-condensable species like Sulfur monoxide preventing SO2 in Io's upper atmosphere from condensing.

Cruikshank et al. examined their observations taken at IRTF and found no evidence of changes in Io's albedo or the area of three SO2 absorption bands at 3.56 μm, 3.78 μm, and 4.07 μm. What changes were observed were either the result of the rotation of Io during the 60-90 minutes of each observation run, were found in one absorption band but not in the other three, or were the result of observation noise or the thick airmass of Earth's atmosphere. Therefore, the authors were not able to confirm the VIMS results published by Bellucci et al. 2004. The authors suggested that the two conflicting results could be due to the background frost coverage in the area observed by the two groups of researchers. VIMS observed Io's trailing hemisphere which is thought to have the least abundant SO2 frost coverage while the Cruikshank et al. group observed the sub-Jupiter hemisphere, SO2 abundance is higher. The lower SO2 abundance would have made condensed SO2, even if in a very thin layer, more noticeable compared to the sub-Jupiter hemisphere.

In other results, Cruikshank et al. observed additional SO2 absorption bands between 2.11 and 2.24 μm, including a faint one at 2.198 μm that the authors thought they were first to see in Io's near-infrared spectrum. Another weak absorption band at 2.1255 μm was mapped by Laver and de Pater and the results of that study were published earlier this year and discussed on this blog. Cruikshank et al. also observed Io's emission spectrum while the satellite was still in the shadow of Jupiter during the observation run on June 22, 2004. They did not find convincing evidence for condensed SO2 in Io's atmosphere, which would be expected in Io's volcanic plumes. This negative result could be the result of the temporal variability of Io's plumes.

Finally, the table of contents for the October 2009 issue of Icarus has been published online. No Io-related papers in this issue, but there are a series of papers covering Jupiter's Oval BA, also known as Red Spot Jr.

Link: Eclipse reappearances of Io: Time-resolved spectroscopy (1.9-4.2 μm) [dx.doi.org]

Sunday, February 22, 2009

Paper: Io's Dayside SO2 Atmosphere

As I pointed out yesterday, two papers were added to the journal Icarus's Articles in Press. The first that I want to summarize here is titled, "Io's Dayside SO2 Atmosphere." The authors of this paper are Lori M. Feaga, Melissa McGrath, and Paul D. Feldman. The authors of this paper examined far-ultraviolet data acquired by the STIS instrument on the Hubble Space Telescope between 1997 and 2001 to see what this dataset can tell us about the density of Io's atmosphere and how it varies across Io's disk.

During the Galileo mission, the Hubble Space Telescope was tasked at various times between 1997 and 2001 with observing Io during the telescope's Space Telescope Imaging Spectrograph (HST/STIS). Feaga et al. took a look at the data in the range of the HI Lyman-α line (around 1216 Å or 121.6 nm) and studied the spatial and temporal variations of that spectral line's emission from Io's surface. This research builds on previous work by Feldman et al. 2000 that found that the level of emission in this far-ultraviolet spectral line is related to the column density of the atmosphere. Gaseous sulfur dioxide is a continuum absorber in this region of the spectrum, so as the column density of the SO2 in Io's atmosphere increases, less of the Lyman-α emission from the sun reaches the surface and is reflected back into space for the HST to observe it. Looking at an example image above, the dark regions on Io's disk (marked by the white circle) are places where Io's atmospheric SO2 is densest and bright areas are where gaseous SO2 is less dense. Feldman et al. 2000 found that Lyman-α emission from Io peaks at the satellite's mid-latitudes and is lowest within the equatorial region, suggesting a latitudinal dependence on the density of Io's atmosphere.

This new paper by Feaga et al. continues the research started in the 2000 paper by looking at the more complete HST/STIS dataset covering a greater longitude range than the earlier work by Feldman et al. This allowed the authors to look into spatial and temporal variations in the SO2 column density. The authors found that Io's atmosphere, in addition to the latitudinal dependence also seen in the earlier work, was densest and had the greatest latitudinal extent on Io's anti-Jovian hemisphere (particularly at the longitude range of Bosphorus Regio) and was narrower in latitudinal extent and less dense on Io's sub-jovian hemisphere. The greatest SO2 column density was seen near 140° at 5 x 1016 cm-2. However, they do note some limitations for their method for deriving SO2 column densities. For example, the densities near the equator are often high enough that the amount of signal from the surface is quite low, low enough to be effected by some of their data reduction procedures, such as removing the Lyman-α emission from the interplanetary medium and removing the effect of albedo variations on Io's surface (their albedo map comes from a nearby wavelength range and was scaled to the extected brightness range expected at 1216 Å). They found few examples of major changes in the density and extent of Io's atmosphere, suggesting that the atmosphere is stable over periods of five years or more.

The authors also looked at how their gaseous SO2 map with the distribution of volcanic hot spots and plumes as well as the distribution of sulfur dioxide frost on Io's surface as found by Doute et al. 2001. They argue that from these comparisons that their results best support a volcanically-driven atmosphere, as the equatorial and anti-jovian concentrations of gaseous SO2 is best comparable with their map of hotspots and plumes. However, it should be noted that their map is still consistent with the distribution of large-grained SO2 as found by Laver and de Pater 2009. In a sublimation-driven atmosphere, SO2 frost in the warmest regions of Io (the equatorial regions) would be the source, so the Laver and de Pater map maybe more relevent for comparison. In addition, in a volcanically-driven atmosphere, I would have expected more examples of changes as the result of variations in volcanic activity, though a few possible examples were found at Pele and Prometheus.

Finally, the authors looked at how their data compares to other measurements made by other researchers. They found that their distribution map is similar to what others have found with Io's anti-jovian hemisphere having a greater latitudinal extent and column densities of SO2 gas than the sub-jovian hemisphere and with greater SO2 column densities near the equator compared to the mid-latitudes and polar regions. They found that column density numbers, particularly in the equatorial regions, tended to be lower than other authors, such as Jessup et al. 2004 and Moullet et al. 2008. The authors suggest that the low signal-to-noise ratio within the equatorial region may make some of the measurements lower limits, though they may not be consistent with some results from Spencer et al. 2005, which predicts much higher column densities at mid-latitudes than what was found in the HST/STIS data.

Link: Io's Dayside SO2 Atmosphere [dx.doi.org]

Saturday, January 24, 2009

Paper: Io's atmospheric dynamics during and after eclipse

Published today in the journal Icarus's Articles in Press page is a new article by Chris Moore, D. B. Goldstein, P.L. Varghese, L.M. Trafton, and B. Stewart titled, "1-D DSMC Simulation of Io's Atmospheric Collapse and Reformation During and After Eclipse." Note that this article requires a personal or institutional subscription to access. The article presents a computer model of Io's atmosphere during an eclipse of the Sun by Jupiter and how non-condensable chemical species in the atmosphere effect gas number densities and collapse times.

Io's thin atmosphere is primarily composed of Sulfur dioxide (SO2), a chemical that also dominates Io's volcanic gases and great gray-white snow fields. The atmosphere of Io is basically in equilibrium vapor pressure with the surface. In other words, the colder the surface temperature, the more SO2 that is condensed out on the surface. The warmer the surface temperature, the more SO2 that sublimates into the atmosphere. In addition to SO2, Sulfur monoxide (SO) and molecular oxygen, disassociative products of SO2, are also present in the atmosphere at much smaller mole fractions.

The sudden onset of eclipse for the sub-Jupiter hemisphere brings dramatic surface temperature changes and with it atmospheric changes. Before an eclipse, the molecules (within one scale height of the surface, or 10 km) are well mixed with about 80% SO2 and 20% non-condensable species like SO and O2. Above 10 km, the molecules are not collisional and therefore have different scale heights depending on molecular weight. The general picture of what happens during an eclipse, as modeled by Moore et al. can be seen in the cartoon at left. As the eclipse begins, a significant amount of the SO2 in Io's lower atmosphere condenses onto the surface as the surface cools rapidly from 120K at the sub-solar point to ~105-110 K. SO2 in the upper atmosphere does not condense out because of the lag time for the upper atmosphere to sense the temperature change at the surface. This lag is further complicated by energy supplied by the plasma torus which keeps the upper atmosphere's temperature "artificially" inflated. As the eclipse progresses, more SO2 condenses out, but the rate slows as more plasma from the torus reaches the surface, keeping the temperature of the SO2 in the lower atmosphere inflated above what it normally would be if it were in perfect vapor pressure equilibrium. In addition, SO, enhanced in mole fraction as much of the SO2 in the lower atmosphere has condensed into a frost on the surface, forms a diffusion layer near the surface, preventing SO2 higher up in the atmosphere from condensing out. After the eclipse, the SO2 frost that had condense during the eclipse starts to sublimate. This vertical motion in the atmosphere pushes the diffusion layer SO higher up in the atmosphere. Within 30 minutes of the end of the eclipse, the lower atmosphere consists primarily of SO2 while the upper atmosphere is composed of 70% SO2 and 30% SO. Over the next half day, the atmosphere re-equlibrates back to the situation prior to the eclipse.

While the surface goes through a similar rapid drop in temperature at sunset, the greater length of night and lateral winds mean that the non-condensable species don't have the same effect as they do during an eclipse.

These changes in the atmosphere effect Io's auroral emission, seen in color by Galileo in 1998 (picture shown at top). Most of the auroral emission comes from the upper atmosphere. The fact that upper atmosphere does not condense is consistent with Geissler et al. 2001's observation that the auroral glows observed by Galileo do not dim with time elapsed since eclipse ingress.

Link: 1-D DSMC simulation of Io's atmospheric collapse and reformation during and after eclipse [dx.doi.org]

Friday, January 9, 2009

New Paper: Distribution of SO2 Ice on Io

A new Io-related paper was posted online on the journal Icarus's Article-in-Press page, "The global distribution of Sulfur Dioxide ice on Io, observed with OSIRIS on the W.M. Keck telescope" by Conor Laver and Imke de Pater. This paper covers K-band (1.97-2.38 μm), high-spatial and spectral resolution observations of Io's leading and trailing hemisphere acquired by the OSIRIS near-infrared spectrometer at Mauna Kea's Keck II telescope. This is the third in a series of papers by Laver and de Pater based on observations acquired in April and June 2006. The first paper, published in Icarus in 2007, covered an outburst eruption at Tvashtar Patera in April 2006. The second paper, published in Icarus in 2008, covered observations acquired in April 2006 of SO2 frost distribution across Io's leading hemisphere.

In their most recent paper, Laver and de Pater explore data acquired on June 1 and 2, 2006 to look at SO2 frost/ice distribution across the leading and trailing hemisphere of Io. In particular, they look at two weak SO2 absorption bands at 1.981 μm (3ν1 + ν3 vibrational mode) and 2.126 μm (ν1 + 3ν3). In addition to including coverage over the trailing hemisphere, the data from June have a higher spatial resolution (65 km at Io's equator) than the April data that was the subject of last year's paper. Like the NIMS and VIMS instruments on Galileo and Cassini, respectively, the OSIRIS instrument produces a reflectance spectrum for each of the nearly 2000 pixels that cover the disk of Io. From these reflectance spectra and following some calibration procedures described in the paper, the authors calculated the equivalent width (a method of both measuring the strength of an absorption band and normalizing it to the surrounding continuum) and the Full-width at half-maxium (FWHM; basically the wavelength width of the absorption band in nanometers) for each of the two absorption bands. Based on these calculations, the authors can then measure the fractional coverage of SO2 for each pixel in their map based on the equivalent width and a lower-limit grain size of 700 μm. Theoretically, differences in the FWHM can be used the look at differences in grain size across Io, but the spectral resolution was not high enough to explore this. Based on the observed FWHM and the depths of these bands, a grain size lower limit of 700 μm was determined.

The authors found an enhancement of SO2 frost within Io's bright equatorial regions, such as Bosphorus Regio, Colchis Regio, Tarsus Regio, and Media Regio and a significant deficiency in SO2 frost west and southwest of Pele on Io's trailing hemisphere. The authors compared these results to similar studies conducted using Voyager ISS data (McEwen 1988) and Galileo NIMS data (Carlson et al. 1997 and Douté et al. 2001). The maps created by Laver and de Pater agree fairly well with McEwen and Carlson's weaker band results, but disagree strongly with Douté and Carlson's stronger band results. The differences observed are likely due to the latter maps showing the distribution of small grained SO2 while the results from weaker bands, like those observed by Laver and de Pater, are sensitive to larger grained ice.

The maps by Douté, for example, show higher concentrations of small-grained SO2 at mid-latitudes, particularly north and south of Pele. Laver and de Pater theorize that this difference in the distribution of small- and large-grained SO2 frost results from frost grains annealing in the warmer, equatorial regions (similar to aging snowfields on Earth, just imagine the difference between walking on freshly fallen snow and snow that's been on the ground for a few days, though some of that is due to shrinking pore space between ice grains and diurnal freeze/thaw cycles). At mid-latitudes, frost grains are cooler, and don't anneal to the degree they do at the equator.

Overall, an interesting paper that was quite easy to follow, despite being a spectroscopy paper ;) The authors hope to acquire additional observations of these regions to improve the signal-to-noise ratio of their maps.

Link: The global distribution of Sulfur Dioxide ice on Io, observed with OSIRIS on the W.M. Keck telescope [dx.doi.org]

Friday, April 11, 2008

Renewed Explosive Volcanism at Kilauea

A second explosive eruption took place at Halema`uma`u crater atop the Kilauea volcano on Wednesday morning. The eruption, along with winds out of the south, lowered air quality across the more populated areas of the Big Island, including Hilo. This was due to the high amounts of sulfur dioxide within the new vent's gas plume. Sulfur dioxide, a common volcanic gas on Io and Earth, can causes irritation to a person's respiratory system.

Webcam images of the new vent along the wall of Halema`uma`u crater reveal a large, white plume and glowing red lava being spat out of the vent. The new explosion has expanded this vent by 5-10 meters. Debris from the explosion, smaller than the one that took place last month, could be found on the rim of the crater, 70 meters above the vent.

Air quality in Hilo is expected to improve as returning trade winds will blow the sulfur-rich plume to the southwest, away from major population centers.

Link: Halema`uma`u vent explodes a second time [hvo.wr.usgs.gov]

Monday, March 24, 2008

S2O, polysulfuroxide and sulfur polymer on Io’s surface?

The other Io-related paper in the April 2008 issue of the journal Icarus is titled, "S2O, polysulfuroxide and sulfur polymer on Io’s surface?" and is written by Donia Baklouti, Bernard Schmitt, and Olivier Brissaud. Such research is important as the presence of condensed S2O is one explanation for the reddish deposits near some volcanoes.

In this paper, the authors performed laboratory experiments on S2O, a compound predicted to be among the gases expelled by volcanoes on Io but to date not observed. The authors synthesized the compound from gaseous SOCl2, then allowed the product to condense on a target in temperature and pressure conditions expected on Io. This experiment was preformed several times, with different temperature conditions applied to the sample, and with some having pure S2O in the initial gas and others with 2-10% S2O in a matrix of SO2, to match the expected gas composition at Io's volcanic vents. At various times, the authors then measured the visible and infrared spectra of the sample plate and compared their results to Galileo NIMS data of Io's surface.

In both gas samples, much of the S2O disproportionated into sulfur and SO2 before condensing on the sample plate. When the sample plate was at a temperature below 120K, the resulting condensation was often a mixture of SO2, sulfur, and a small amount of S2O. Above that temperature, SO2 can not condense or sublimates when the sample plate is heated above that temperature, leaving behind the sulfur and S2O. However, the S2O does not stick around for long as it polymerizes, forming longer chains of polysulfuroxides until the molecules lose more and more of their oxygen and yellow sulfur polymers are formed as the temperature is raised more. These results suggest that on Ionian surfaces below 120K, the appearance of S2O would be masked by the presence of SO2, forming whitish deposits, and sulfur polymers, while above that temperature S2O is converted into yellowish polysulfuroxides. These results further suggest that S2O can not explain the reddish deposits seen at some volcanoes. This further supports the idea that these deposits are formed from the condensation of S3 and S4 that is directly vented from Io's interior.

The authors compared their visible and infrared spectra measurements to Galileo NIMS spectra of Io. The authors found that many S2O absorption bands either occur on the wings of strong SO2 bands, which dominate Io's infrared spectrum, or are too shallow or would occur over too small a surface area to be observed by NIMS. The NIMS spectra is better explained by a combination of SO2, stable S8, and sulfur polymers.

Link: S2O, polysulfuroxide and sulfur polymer on Io’s surface? [dx.doi.org]

Tuesday, March 18, 2008

Solfataras at Kilauea

The Honolulu Star-Bulletin reported today on a brand new gas vent at the Halema`uma`u crater at the Kilauea volcano on the island of Hawaii. This gas vent, also known as a solfatara or fumerole, has emitted a large amount of sulfur dioxide, sulfur trioxide, and water vapor over the last few days to the point where health warnings and closures have been issued for the area around Kilauea. Also in the last few days, dull red glowing material has been visible near these vents. The temperature of this material is only 772 K, which might be indicative of molten sulfur.

Solfataras might be a good terrestrial analog for Io's Prometheus-type plumes. These plumes are thought to be formed when silicate lava interacts with sulfur dioxide frost on the surface.

Link: Glowing sulfur stumps brains at volcano site [starbulletin.com]

Wednesday, March 12, 2008

Sulfur dioxide and Sulfur in Tvashtar's Plume

There is a nice blog post by Ted Stryk, guest blogging for the Planetary Society at the Lunar and Planetary Sciences Conference, on some of the presentations from last night's poster sessions and yesterday afternoon's lunar session. One of posters Ted highlights is the one by Kandis Lea Jessup and John Spencer titled, "Detailed Analysis of the Tvashtar Plume Spectral Behavior." I highlighted the abstract for this poster last week.

Ted reports that the authors have determined that the S2 to SO2 ratio in the Tvashtar plume was between 0.01 and 0.02. In other words, in their measurements based on images taken by Hubble last February, the plume consisted of significantly more Sulfur dioxide than diatomic Sulfur. This value would seem to be in conflict with the presence of a red ring plume deposit, which is thought to be caused by the deposition of sulfur from Io's plumes. However, measurements of the Pele plume suggest that the Sulfur to Sulfur dioxide in these larger plumes can vary between 0.01 and 0.3, so the low ratio at Tvashtar may not be representative of the average.

Another consequence of the low S2/SO2 ratio is that the high optical depth seen in the Hubble WFPC2's F255W filter (an ultraviolet filter that senses gases in Io's plumes, rather than the dust seen in visible wavelength images like the LORRI images above) was not due to absorption by S2, but instead is due to SO2.

An interesting result. Definitely indicates that Tvashtar's plume was quite gas rich.

Saturday, March 8, 2008

LPSC 2008: An Assessment of Near-Surface Conditions Conducive to Ionian Sulfur Flows

Arizona State University's Ramses Ramirez, Dave Williams, and Ron Greeley have a poster at next week's Lunar and Planetary Sciences Conference titled, "An Assessment of Near-Surface Conditions Conducive to Ionian Sulfur Flows." In this poster, the authors look at whether the bright flows seen at Sobo Fluctus (left) could have been generated secondary sulfur flows heated by a near-surface magma chamber.

In the model used by Ramirez et al., they consider a near-surface magma chamber whose heat is conducted by the surrounding silicate-sulfur country rock to the surface. They then estimated the amount of sulfur that would be melted by such a magma body and compared that to the size of the flows seen at Sobo Fluctus.

The authors determined that the amount of sulfur melted by a near-surface magma body was insufficient to explain the bright flows seen at Sobo. They suggest that the flows are instead primary sulfur flows, erupted from a vent with lava originating in a sulfur magma chamber below the surface.

Interesting work that further suggests the possibility of sulfur flows on Io, at least at some select locations. Many of these flows seem to occur outside of paterae. One possibility is that such activity is usually part of the first stages of paterae formation.

To create the above image of Sobo Fluctus, I reprocessed the entire CAMAXT01 mosaic from I27, which covers the region between Chaac Patera and Camaxtli Patera. Hope you all enjoy!

Link: An Assessment of Near-Surface Conditions Conducive to Ionian Sulfur Flows [www.lpi.usra.edu]

Monday, March 3, 2008

LPSC 2008: Detailed Analysis of the Tvashtar Plume Spectral Behavior

In the second LPSC abstract highlighted on this blog, Kandis Lea Jessup and John Spencer present the work they have done on Hubble images of Io taken during last year's New Horizons encounter. In particular, they are using the images they acquired at different wavelengths with Hubble's Wide Field and Planetary Camera 2 to study the spectral behavior of the Tvashtar plume.

While the images acquired by Hubble have a lower spatial resolution than those taken by New Horizons' LORRI camera (180 km per pixel for the WFPC2 versus at top resolution of 11.2 km per pixel for LORRI), the WFPC2 has a higher spectral resolution than New Horizons' MVIC instrument, particularly at ultraviolet wavelengths which is particularly important for identifying gases within Io's plumes. Jessup and Spencer observed Io and the Tvashtar plume on multiple occassions last February, allowing the authors to examine the plume's reflectance spectra (i.e. looking at how much light reflects off the plume, which can depend on composition, particle size, and phase angle) and absorption spectra (i.e. looking at how much light from the background Jupiter passes through the plume to Hubble).

The authors found the plume to be most noticeable in both sets of observation in the ultraviolet F255W filter, indicative of S2 gas in the plume. The authors had a similar result at Pele in 2000. They do note that the Tvashtar plume has a much higher optical depth in the F255W filter than Pele.

Interesting work. They do promise to present more work on how optical depth varies by wavelength for both Pele and Tvashtar in their poster. It is so interesting to see just how similar the Pele and Tvashtar plumes despite the apparent difference in volcanic styles: Pele being a vigorously erupting lava lake and Tvashtar being a fissure eruption. Must have to do with the magmas at both locations having a higher volatile content, allowing the formation of a bright lava fountain at Tvashtar and a constantly overturning lava lake at Pele. Note the fact that as far as I know, Pele and Tvashtar are the only two volcanoes where using relatively short exposures, it is easy to see their hotspots in the daylight, at wavelengths less than 1 micron, and at relatively low resolutions.

Link: Detailed Analysis of the Tvashtar Plume Spectral Behavior [www.lpi.usra.edu]